A sharp step is coming, either bullish or bearish
Housing Starts and Manufacturing Shipments were released in Canada and the US will publish TICS and NY Fed Empire State manufacturing index. Meanwhile on the price chart, the price line broke the dynamic support. This could be a fake break, in this case the next few candles would pump the price into the channel again. On the other hand, if this theory does not trigger, the next step would be a powerful dump.
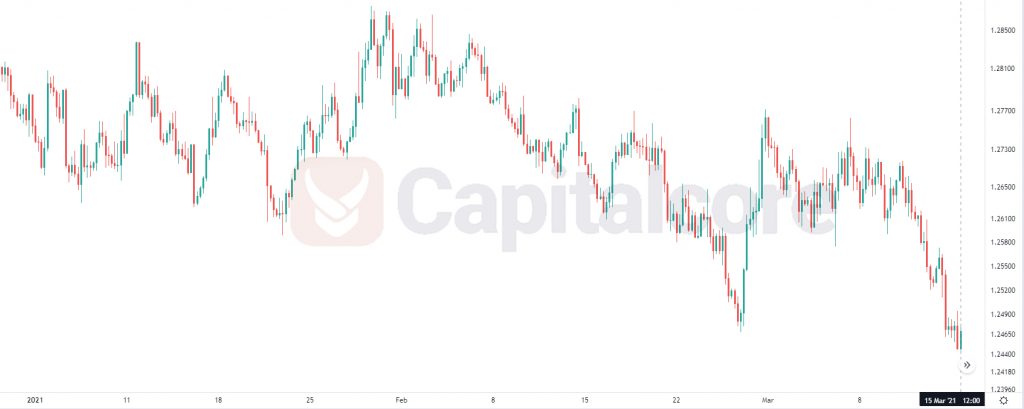
Chart Notes:
• Chart time-zone is UTC (+03:00)
• Candles’ time-frame is 4h.
The pair is finding support at 1.24150 with resistance at 1.25090 which the weekly pivot point at 1.25460 is located above the lines. The EMA of 10 is moving with bearish bias in the descendant channel and it is located below the EMA of 200 and the EMA of 100. The RSI is moving in oversold area, the MACD line is below the signal line in the negative territory and the Stochastic is moving in low ranges. The ADX is showing sell signal. The price is below the Ichimoku Cloud and the Chinkou Span. The Tenkan-sen and the Kijun-sen are both showing a downward trend.
The support level breakthrough may push the price down towards 1.23700; otherwise USDCAD will be consolidating below the pivot point.
• DISCLAIMER: Please note that the above analysis is not an investment suggestion by “Capitalcore Ltd”. This post has been published only for educational purposes.