Potential Bearish Continuation for USD/CHF
The USD/CHF pair indicates a potentially overbought condition with the Stochastic RSI above 65%. The RSI line cutting above the base line suggests a bullish correction, but caution is advised as the candlesticks reside within the red cloud of the Ichimoku indicator, indicating a resistance zone and potential bearish pressure.
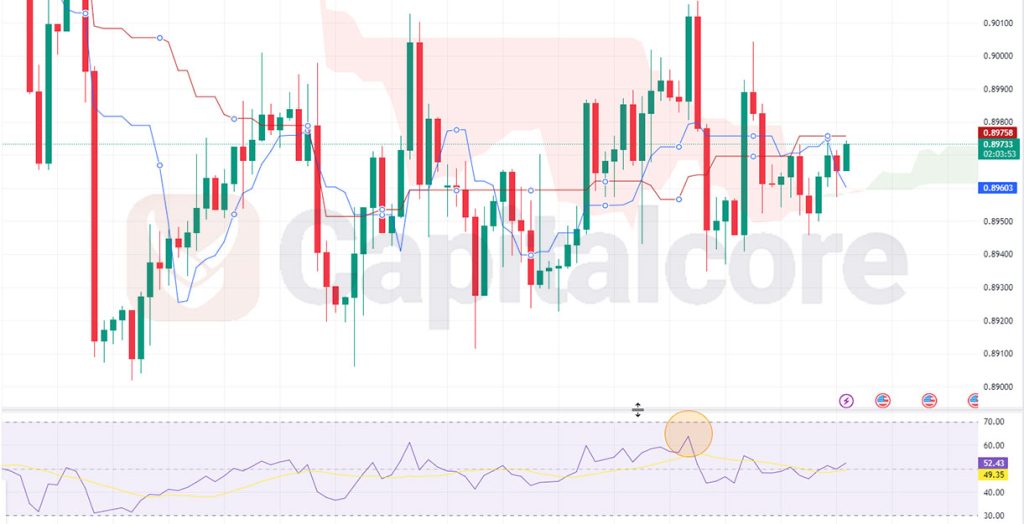
Chart Notes:
• Chart time-zone is UTC (+03:00)
• Candles’ time-frame is 4h.
The USD/CHF pair exhibits multiple indications that suggest a mixed outlook. Firstly, the Stochastic RSI (SRI) reading above 65% signals a potential overbought condition. Secondly, the RSI line cutting above the base line implies a bullish correction. However, caution is warranted as the candlesticks remain within the red cloud of the Ichimoku indicator, indicating a resistance zone and potential bearish pressure. Additionally, the conversion line cutting across the candles indicates a shift in momentum. Notably, the conversion line below the base line suggests a slightly bearish bias. Traders should closely monitor these factors and exercise caution when making trading decisions on the USD/CHF pair.
• DISCLAIMER: Please note that the above analysis is not an investment suggestion by “Capitalcore Ltd”. This post has been published only for educational purposes.