Bearish market is expected
USD/CHF started a sideway range after experiencing a descend, about 12% . The price line then entered a wedge pattern on 6th of January; The price line started bouncing between a support and a resistance level, shown with red lines on the picture. On 24th of the December 2021, the price line could finally break below the support line and right now the overall look of the chart is bearish.
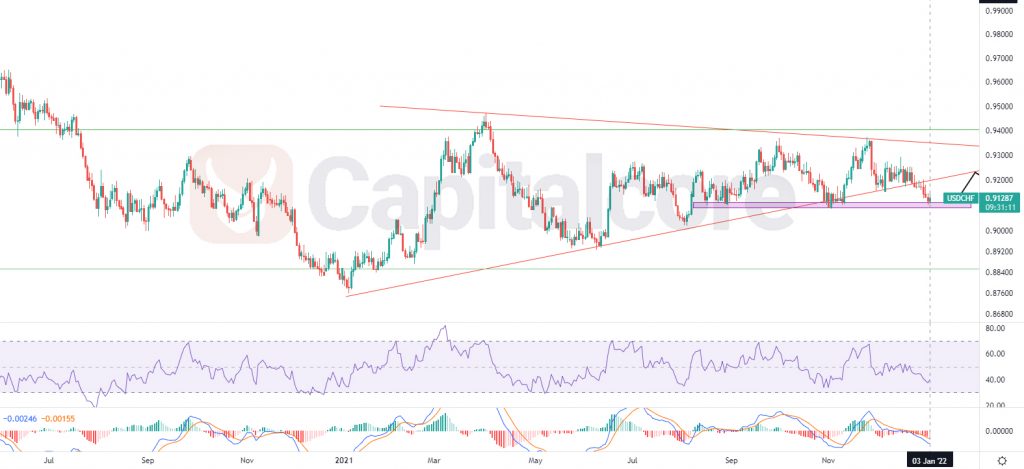
Chart Notes:
• Chart time-zone is UTC (+03:00)
• Candles’ time-frame is 4h.
At the moment the price line is on 0.9129. There is a support level just below the price line, on 0.90877-0.91111 Which has been highlighted purple on the picture. RSI is almost on 37 and MACD is showing weakening of the descending wave. The price is expected to start a temporary ascending wave and after having a retest of the broken trend line, The price line could continue the descending wave. Sellers can set their orders on 0.9218 – 0.9236 which would be almost on the flat of the Ichimoku cloud as well as the broken support level. The target for bears can be considered 0.90212, 0.8937 and 0.8855. Please consider that in case the price line breaks above 0.93, the possibility for the descend would highly reduce.
• DISCLAIMER: Please note that the above analysis is not an investment suggestion by “Capitalcore Ltd”. This post has been published only for educational purposes.