The wedge is about to be broken
The price line, on USD/CHF chart, has recently been reducing its movement range. The climax of each wave is being formed below the previous one and the valley is being formed above the previous valley. The dynamic support and resistance level are getting closer and the next move of the price is of high value.
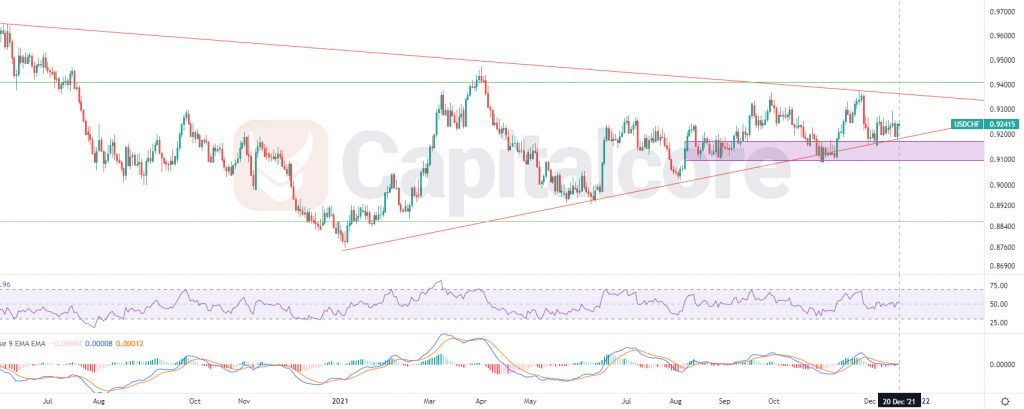
Chart Notes:
• Chart time-zone is UTC (+03:00)
• Candles’ time-frame is daily.
The closest static support level to the price, lays at 0.9172 – 0.9084. The red line below the price line shows the dynamic support level and the red line above the price line is showing the dynamic resistance level. The price line, at the moment is on 0.92415 and RSI is almost on 50. MACD is showing a potential ascending wave as the MACD line is about the cut above the signal line and the histogram bars are about to turn green. The overall look of the chart is bullish and buyers should be waiting for the price to break above the resistance level and also level 0.5 of the Fibonacci retracement which lays at 0.941. in case the price line can penetrate this level, buyers can open a long trade. The possible target for the ascending line can be consider 0.99552 and 1.0225 . Please note that breaking below 0.9085 will highly reduce the chance ascending.
• DISCLAIMER: Please note that the above analysis is not an investment suggestion by “Capitalcore Ltd”. This post has been published only for educational purposes.