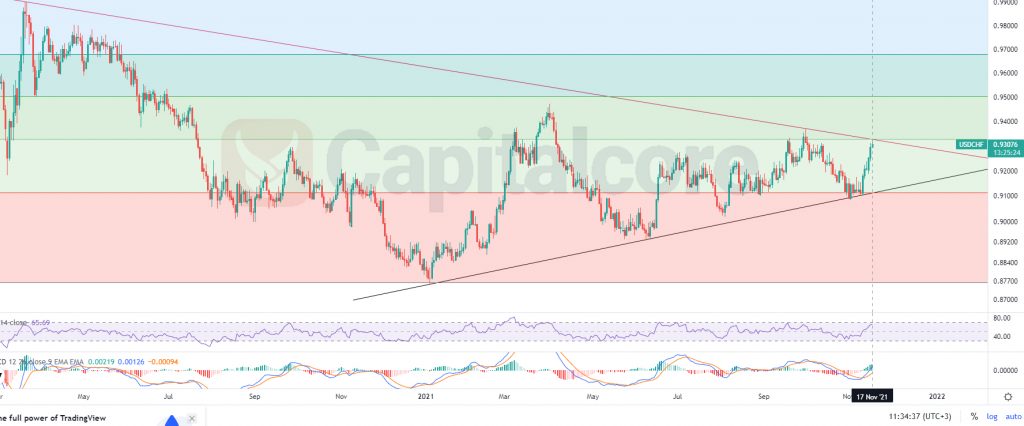
The price line is on a strong resistance
USD/CHF, after a strong descend started an uptrend and could recover up tp 50% before the price dropped again. Bulls are straggling to increase price and break above the strong dynamic resistance; they have, however, not been successful yet.

Chart Notes:
• Chart time-zone is UTC (+03:00)
• Candles’ time-frame is daily.
The pink line indicates the dynamic resistance that started forming on 25th of April 2019. The black line shows the support line, started to form on 7th of January 2021. The price line right now is touching the resistance as well as level 0.382 of the Fibonacci retracement. RSI is on 66 and is showing negative divergence. MACD is showing strong ascending wave going on for several days. The resistance looks to strong to be broken and bears look to have bigger luck in USD/CHF market. Sellers can target level 0.236 of the Fibonacci retracement that would be 0.91127. The next possible target for the upcoming descend can be 0.90207.
• DISCLAIMER: Please note that the above analysis is not an investment suggestion by “Capitalcore Ltd”. This post has been published only for educational purposes.