The strong trend line is gonna dump the price one more time
There are no major economic reports in Switzerland but Retail Sales, Capacity Utilization and Industrial Production data will be released in the US. There will be FOMC members talks as well. All these, are expected to form the next move of USD/CHF, CapitalCore Ltd decides to analyze USD/CHF chart to predict the next possible move.
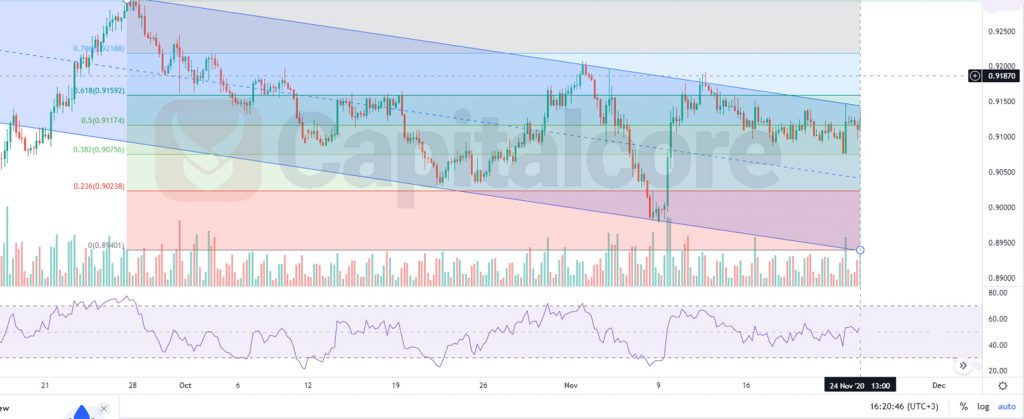
Chart Notes:
• Chart time-zone is UTC (+03:00)
• Candles’ time-frame is 4h.
The support rests at 0.90830 with resistance at 0.91400 which the weekly pivot point at 0.91010 is located in between the lines. The EMA of 10 is moving with bearish bias in the descendant channel and it is located below the EMA of 200 and above the EMA of 100. The RSI is moving in oversold area, the MACD line is below the signal line in the negative territory and the Stochastic is moving in low ranges. The ADX is showing sell signal. The price is in the Ichimoku Cloud and below the Chinkou Span. The Tenkan-sen and the Kijun-sen are both showing a horizontal trend.
Short positions are recommended towards 0.90800.
• DISCLAIMER: Please note that the above analysis is not an investment suggestion by “Capitalcore Ltd”. This post has been published only for educational purposes.