The next wave is going to be sharp
USD/CHF has been bouncing between Fibonacci levels; this has formed a wedge pattern on the USD/CHF price chart. The pattern has not been broken to either sides yet and the wedge is still valid. No clear signals have been issued yet and the next few candles are of high importance.
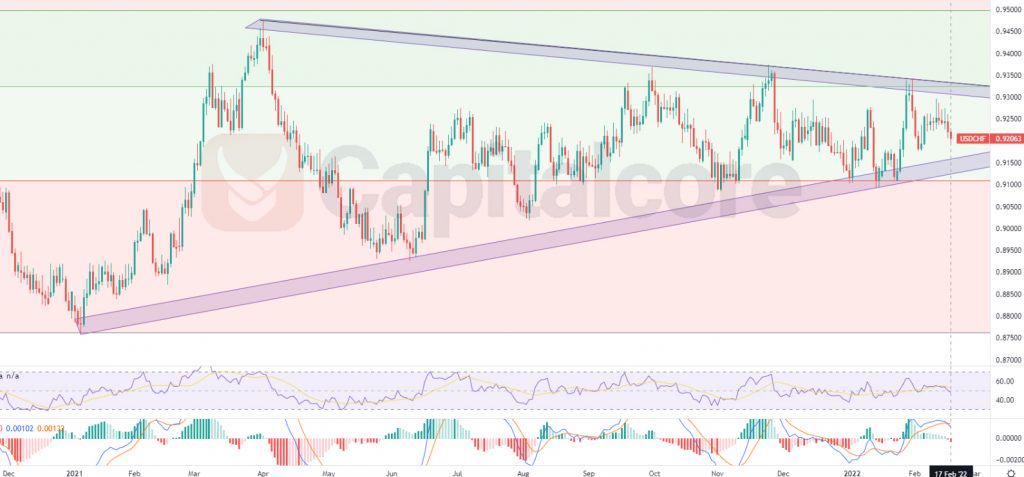
Chart Notes:
• Chart time-zone is UTC (+03:00)
• Candles’ time-frame is daily.
=The price line on USD/CHF, at the moment, is on 0.92063 which would be just above level 0.236 of the Fibonacci retracement. The purple zone below the price line indicates the dynamic support that started forming on 6th of January 2021 and has not been broken to either sides yet. The zone which is above the price line indicates the dynamic resistance; this level is also valid and not broken yet. RSI is almost on 50 and MACD is showing the commencement of a bearish trend. Traders can be waiting for the price line to break through any of the support or resistance level and on the pullback they can enter positions on the same direction as the trend. Possible targets for bears can be considered on 0.89 and 0.875 . On the other hand, in case of ascending, the possible targets can be considered on 0.95 and 0.966.
• DISCLAIMER: Please note that the above analysis is not an investment suggestion by “Capitalcore Ltd”. This post has been published only for educational purposes.