- May 13, 2022
- Category: Market News
Trend reversal might occur shortly
USD/CHF started a bullish trend on first of April 2022 and the price went through a bullish rally and after ascending about 9% in a month, now the price line is on a resistance level at about 1. Different indicators are issuing bearish signal and the price line might go through a correction phase shortly.
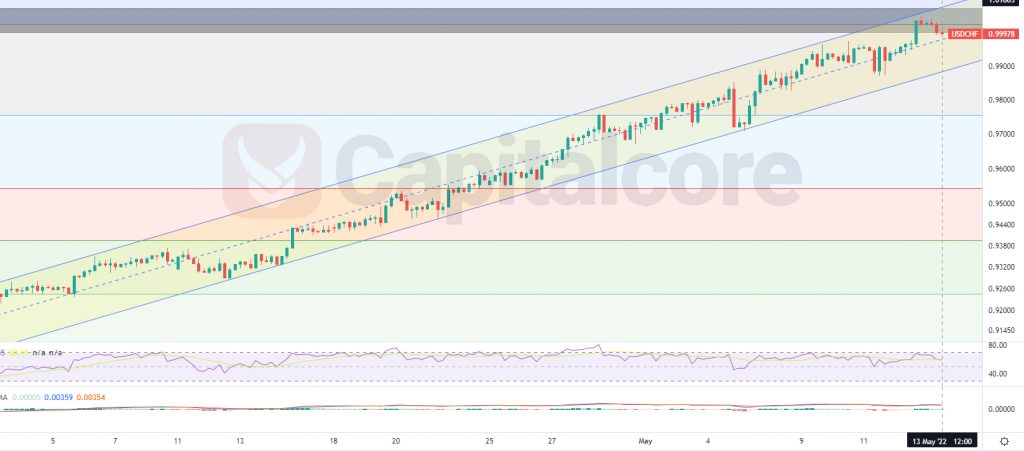
Chart Notes:
• Chart time-zone is UTC (+03:00)
• Candles’ time-frame is 4h.
The price line on USD/CHF price line is showing 0.99978 at the moment, Which would be just below the resistance level at about 1. The light yellow zone indicates the bullish channel which has formed the current ascending wave. The dark zone above the price line indicates the resistance level is considered as a strong resistance as it has been able to dump the price several times in the past and also because it is assumed difficult for the price on this chart to break above 1. RSI is issuing negative divergence on 4h time frame; and in daily time frame, RSI is in over buying area. MACD is showing weakness in bullish trend as you can see on the chart.
Sellers can be waiting for the price line to break below this channel and on the retest, they can enter short positions heading to 0.955 and 0.928. Please note that this analysis would be of value, as long as the price has not broken above the resistance at 1.
• DISCLAIMER: Please note that the above analysis is not an investment suggestion by “Capitalcore Ltd”. This post has been published only for educational purposes.