Trend reversal might be so close
USD/CHF has been moving within a wedge pattern since 22nd of January 2021. After several reactions, a support level was formed below the price line. The price line is now once more reaching to the support level. There has not been any clear signals issued yet but the next few days would be of high importance.
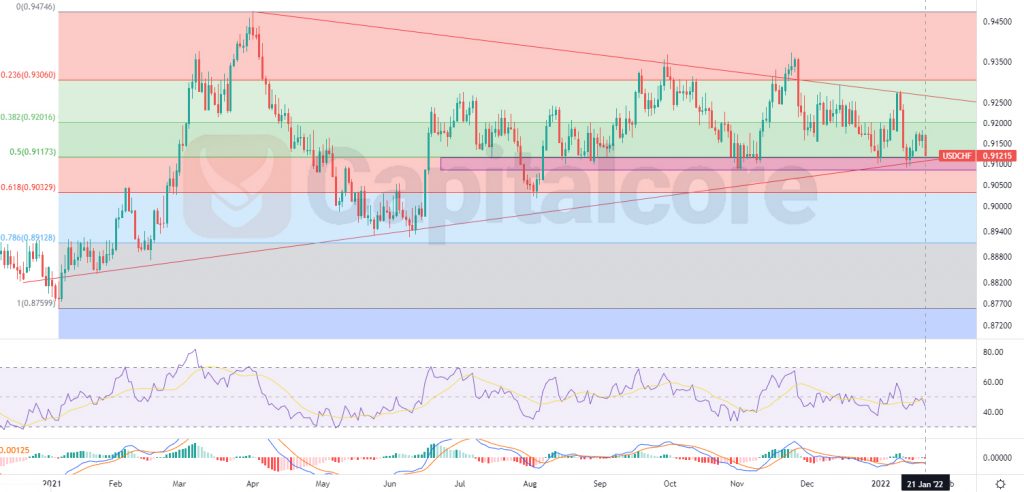
Chart Notes:
• Chart time-zone is UTC (+03:00)
• Candles’ time-frame is daily.
The price line is on 0.91215 at the moment and it is almost on level 0.5 of the Fibonacci retracement. The purple zone below the price line is expected to be a strong support level, as the area has pumped the price several times in the past and also equals to level 0.5 of the Fibonacci retracement. The zone includes 0.90832 -0.91193. Traders can be waiting for the price line to break below the support zone to enter short positions. The target for the descending wave could be considered on 0.90342 and 0.8942. On the other hand, buyers can be waiting for an ascending wave, if the price line breaks above the dynamic resistance which has been shown as a red line above the price line. Under this circumstances, the target for the ascending wave could be considered on 0.9307 and 0.945 after that.
• DISCLAIMER: Please note that the above analysis is not an investment suggestion by “Capitalcore Ltd”. This post has been published only for educational purposes.