Is USD powerful enough to recover?
Foreign Currency Reserves has been published in Switzerland and the US will release Crude Oil Inventories and there will be FOMC Members’ talks. On the chart, a strong descending wave have reached a support level. The next few candles are of high value.
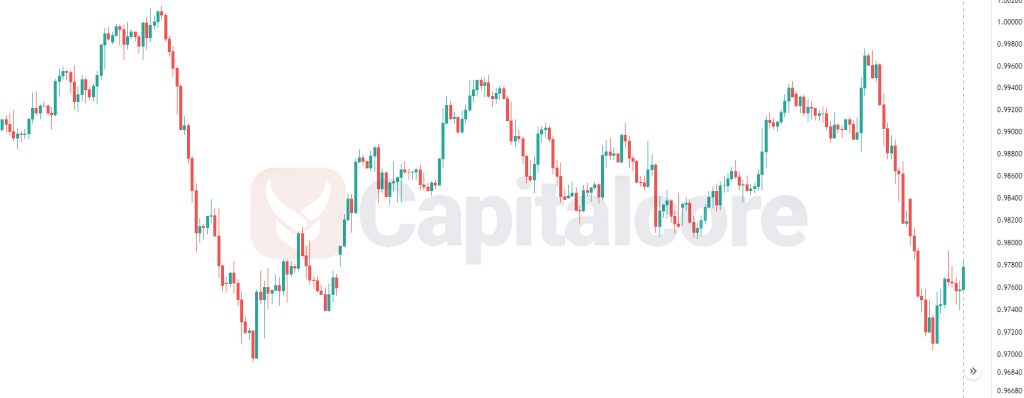
Chart Notes:
• Chart time-zone is UTC (+03:00)
• Candles’ time-frame is 4h.
The support rests at 0.97290 with resistance at 0.97810 which both lines are below the weekly pivot point at 0.98710. The EMA of 10 is moving with bearish bias in the descendant channel and it is located below the EMA of 200 and the EMA of 100. The RSI is moving in oversold area, the MACD line is above the signal line in the positive territory and the Stochastic is showing downward momentum. The ADX is not showing any clear signals. The price is below the Ichimoku Cloud and above the Chinkou Span. The Tenkan-sen and the Kijun-sen are both showing a horizontal trend.
The resistance level breakout will confirm the bullish trend towards 0.9827; otherwise, USDCHF will continue its decline towards 0.9685.
• DISCLAIMER: Please note that the above analysis is not an investment suggestion by “Capitalcore Ltd”. This post has been published only for educational purposes.