The price line is on a resistance level
USD/CHF price, has been bouncing between a resistance level at about 1.00000 and 0.95000 since late April, when the price line could break above 0.95. Currently the price line is once more reaching to the resistance level at 1.00000, after finishing another ascending leg and a bearish leg looks potential on the chart.
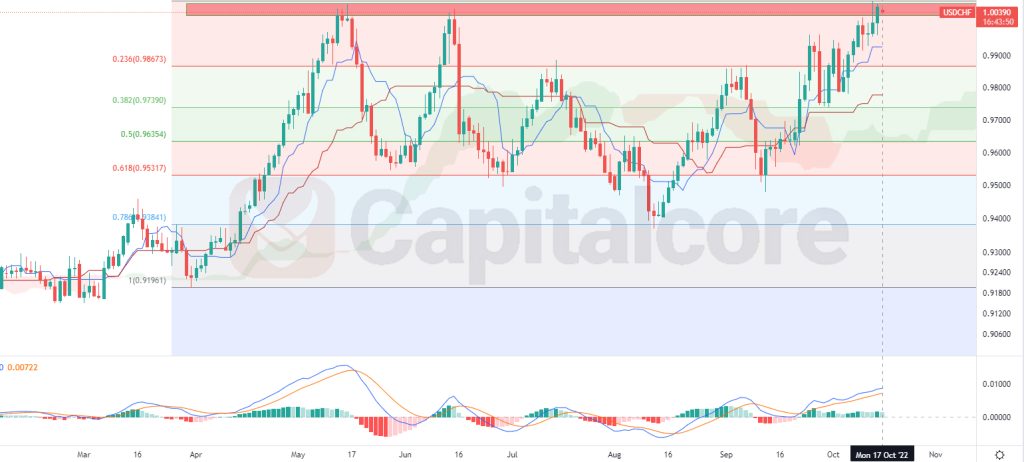
Chart Notes:
• Chart time-zone is UTC (+03:00)
• Candles’ time-frame is daily.
The price line on USD/CHF price chart is indicating 1.0039; where is located just inside the resistance zone at 1.00000. This area is considered important for traders as it has been able to prevent ascending of the price on this pair; it also overlaps with level 0.786 of the Fibonacci retracement on the previous descending wave. A double top pattern has been also formed on the mentioned resistance level and the price is about to form a triple top at the same resistance level. Traders can expect any bearish trigger on shorter time frames and then they can enter short positions. The target for sellers can be set on 0.97455, which is located on level 0.618 of the Fibonacci retracement. The next target can be set on 0.95600. Also note that the validity of this analysis would highly reduce in case the price line breaks above 1.01000.
• DISCLAIMER: Please note that the above analysis is not an investment suggestion by “Capitalcore Ltd”. This post has been published only for educational purposes.