The bearish wave seems to be continuous
The price line on USD/CHF price chart is still moving within a bearish channel and the possibility of a trend reversal does not seem to be high. The volume of the trades is backing up the current trend and MACD is showing a great possibility for the next bearish leg to be happening.
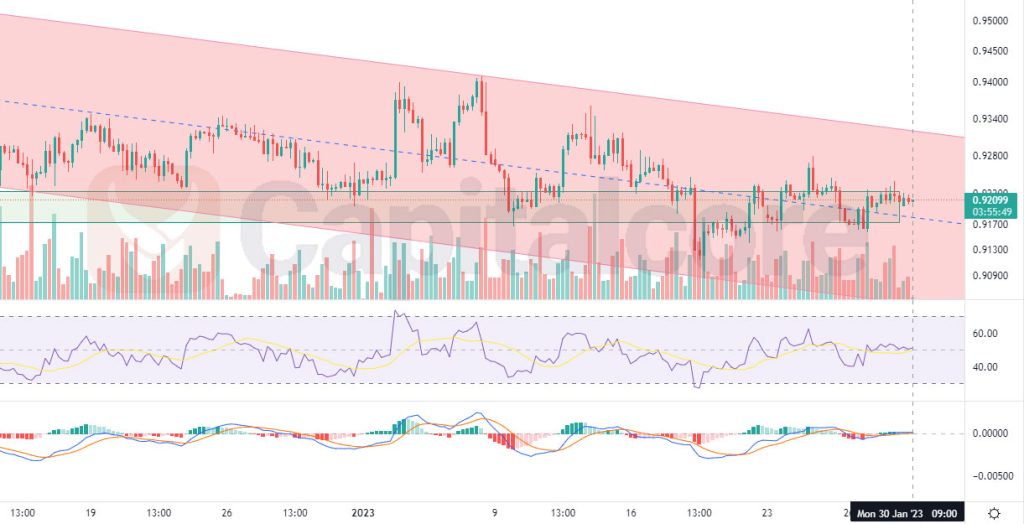
Chart Notes:
• Chart time-zone is UTC (+03:00)
• Candles’ time-frame is 4h.
On November 22, 2022, the price line on the USDCHF price chart began to move within a falling channel. This bearish wave caused this pair’s value to decline by more than 5.2% until January 23rd, 2023. The price line was then slightly inflated as the bearish force on this market began to diminish, and it is currently trying to break over the channel’s midline resistance. An impending bearish wave is indicated by the negative divergence that the RSI has produced, as well as by the Volume of trades. If traders anticipate a bearish trigger, they might enter short positions by moving toward the support zones at 0.91580 and 0.90900 after that.
• DISCLAIMER: Please note that the above analysis is not an investment suggestion by “Capitalcore Ltd”. This post has been published only for educational purposes.