- January 5, 2023
- Category: Market News
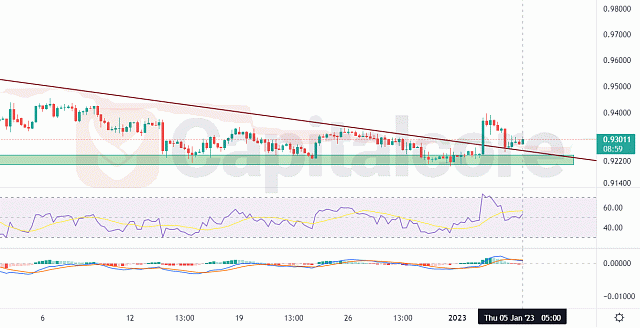
The price line broke above the dynamic resistance
The bulls were finally able to overcome the dynamic resistance above USD/CHF price line, on January the third. Different indicators are now issuing bullish signals and the Candle patterns are also showing potential for an upcoming bullish wave.

Chart Notes:
• Chart time-zone is UTC (+03:00)
• Candles’ time-frame is 4h.
The dark red descending line on the chart indicate the broken trend line, as it can be clearly seen, the price line has already made a pullback to this line and then was slightly pumped. The green box below the price line reflects a static support zone that has already been able to pump the price line several times, and is expected to repeat the same in its next encounters with the price line. Traders could expect a retest of this area, from there they can enter long position and target 0.935000 and 0.94200.
• DISCLAIMER: Please note that the above analysis is not an investment suggestion by “Capitalcore Ltd”. This post has been published only for educational purposes.