- April 27, 2022
- Category: Market News
A descending leg might occur shortly
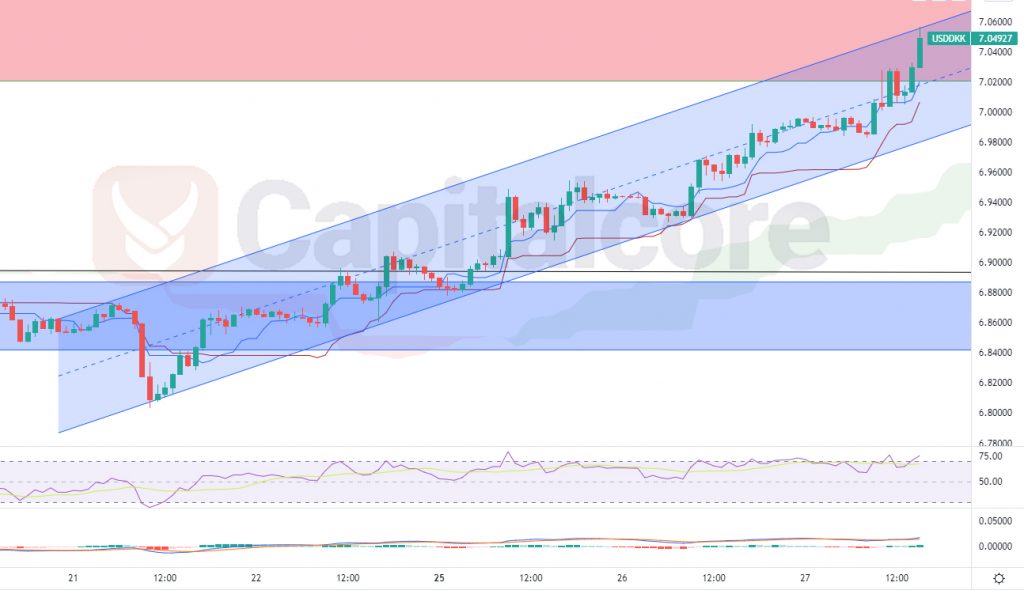
USD/DKK price line has recently ascended sharply; this ascending wave took place within a channel, which started forming on 21st pf April 2022 and could pump the price line up to 3.7% in less than 7 days. The price line is now at the top of the ascending channel and might go through a descending wave shortly.

Chart Notes:
• Chart time-zone is UTC (+03:00)
• Candles’ time-frame is 1h.
The price line on USD/DKK price chart is showing 7.05 which would be just inside a strong resistance zone. The red zone above the price line indicates a strong weakly resistance level; this area lays on 7.02 -7.2. The blue box below the price is showing a support level. As you can see, after reacting to the support zone, the price line formed an ascending channel and has already made several reactions to the base, top and specially mid line of this channel. RSI is above 70 and inside over buying zone and has also issued negative divergence signals. MACD is showing a weak ascending wave. The price line is at the top line of the channel as well as inside a resistance level. Traders can keep an eye on the smaller time frames to find a descending signal and on witnessing any descending trigger, they can enter short positions, heading to the base line of the channel, and in case that area is broken too, the next possible target would be 6.88 – 6.84.
Please consider that this theory would be of value, as long as the price line has not broken above the ascending channel.
• DISCLAIMER: Please note that the above analysis is not an investment suggestion by “Capitalcore Ltd”. This post has been published only for educational purposes.