Bullish wave seems potential
USD/GBP started a descending wave on 23rd of February 2022. This descending wave formed a bearish channel on the price chart. The price line has made several reactions to the top, bottom and mid line of this channel and now is almost on a strong support zone. Some bullish signals have been issued and the price line on this pair is potential to ascend.
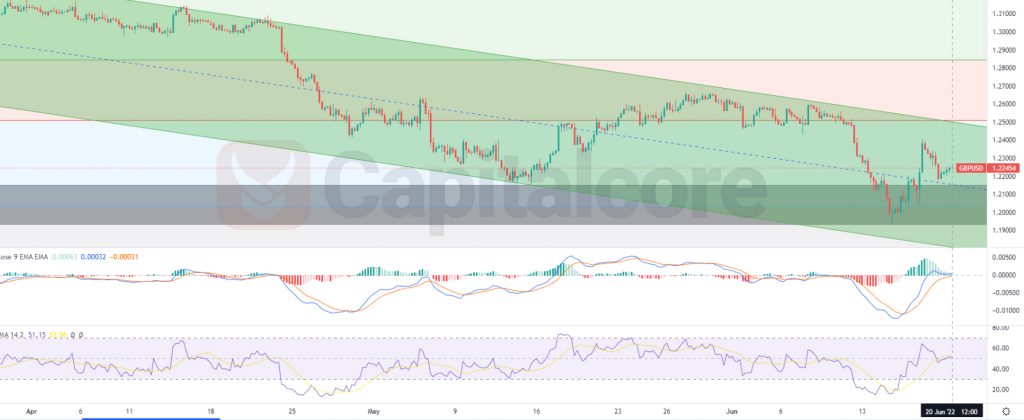
Chart Notes:
• Chart time-zone is UTC (+03:00)
• Candles’ time-frame is 4h.
The price line on GBP/USD price chart is indicating 1.22454 at the moment, which would be just above the midline of the descending channel as well as a strong support level. The descending channel is shown as a green zone on the chart and the static support zone is indicated as a gray box below the price line; this support level is of high importance as it has been able to pump the price line up several times in the past and therefore is not expected to be broken easily. RSI is showing positive divergence and MACD is issuing buy signal. Traders can be waiting for the price line to descend inside the gray zone once more and then they can open long positions heading to 1.26 and 1.3 after that. S
Please note that this analysis would be valuable as long as the gray zone is not broken.
• DISCLAIMER: Please note that the above analysis is not an investment suggestion by “Capitalcore Ltd”. This post has been published only for educational purposes.