- March 31, 2022
- Category: Market News
The price line, on a strong resistance level
The price line on USD/HKD price chart started an ascending wave on 14th of January 2022 and could ascend more than 0.6 until 14th of March 2022 and then the price line started a sideway range and each time, after touching the resistance level, a smooth descending wave occurred.
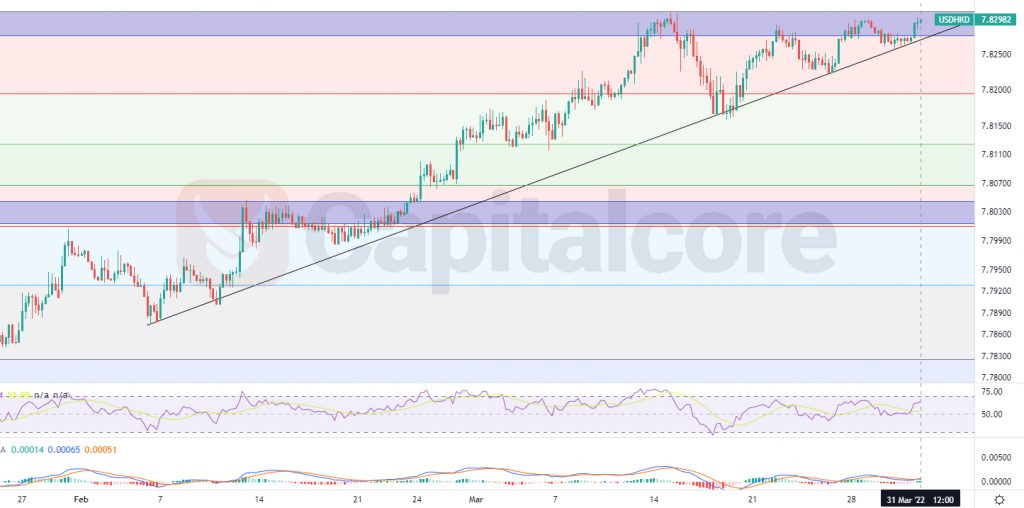
Chart Notes:
• Chart time-zone is UTC (+03:00)
• Candles’ time-frame is 4h.
The price line at the moment is on 7.82982, which would be inside the resistance zoon. The area is of high importance as it has been able to dump the price several times recently. This area is shown as a purple area on the chart, above the price line. The black ascending line on the chart, indicates the trend line which is forming the current ascending line. RSI is almost on 62 and MACD is showing the commencement of an ascending wave. Traders can be waiting for the price line to break below the descending black trend line and then they can enter short position on the retest of the area. the possible targets for the ascending wave could bee considered on 7.82 and 7.801.
• DISCLAIMER: Please note that the above analysis is not an investment suggestion by “Capitalcore Ltd”. This post has been published only for educational purposes.