- May 4, 2022
- Category: Market News
Bearish signals have been issued
USD/HKD price started an ascending rally on 7th of February 2022, The price line on this chart ascended more than 605 pips in less than 2 months and then reached out to a strong monthly resistance. Some bearish signals have been issued and a strong bearish wave might occur soon.
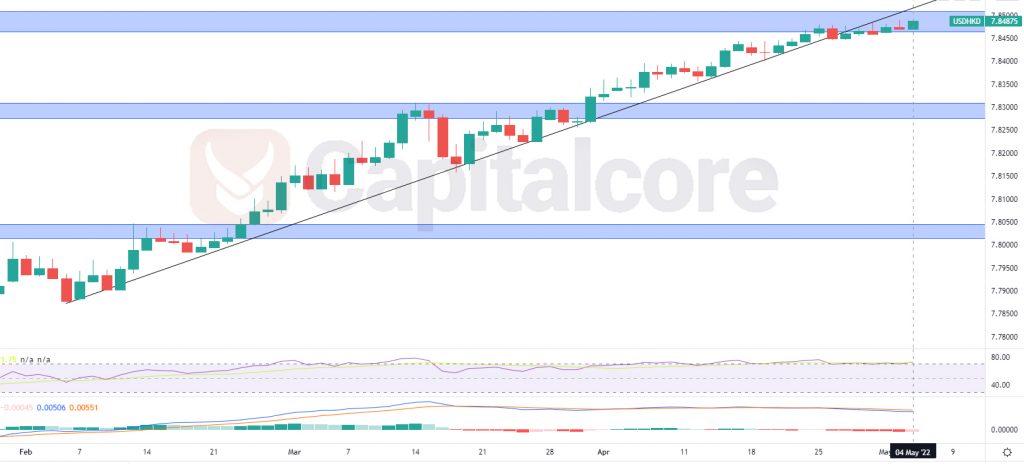
Chart Notes:
• Chart time-zone is UTC (+03:00)
• Candles’ time-frame is daily.
The price line on USD/HKD price chart is on 7.84875 at the moment, which would be just inside the monthly resistance on this chart. The black line on the chart indicates the bullish trend line which has formed the current bullish wave, as you can see on the chart, the price line has recently broken below this line. RSI is showing negative divergence and is also trending in overbought area. MACD is also showing descending wave on going. Traders can be waiting for the price line to break below the blue zone, and then on the retest of this area they can enter short positions; possible targets for the descending wave could be around 7.83 and 7.805, which are shown as blue boxes on the chart.
Please note that, in case the price line breaks above the blue zone, this analysis would be outdated.
• DISCLAIMER: Please note that the above analysis is not an investment suggestion by “Capitalcore Ltd”. This post has been published only for educational purposes.