Bearish signals have been issued
USD/HKD started an ascending rally on 25th of January 2022; the price line ascended almost 0.85% until 9th of May 2022. The market then entered a sideway range and the ascending slope of the chart decreased majorly. Different bearish signals have been issued and a descending wave is potential to occur.
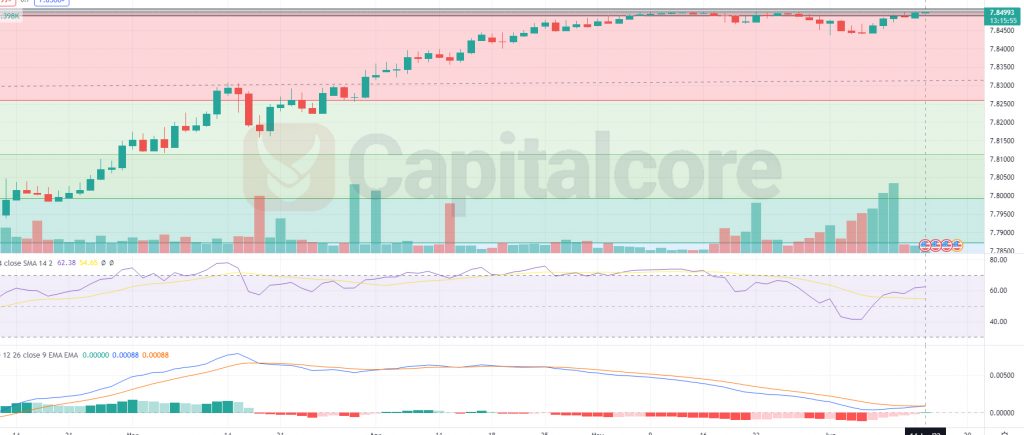
Chart Notes:
• Chart time-zone is UTC (+03:00)
• Candles’ time-frame is 4h.
The price line on USD/HKD is indicating almost 7.85, which would just on a strong monthly resistance level which has not been broken for more than 10 years, despite several attempts that bulls made to pump the price above this zone; therefore this zone contains high importance and validity. RSI has issued a strong negative divergence signal and is now showing almost 62. MACD is showing potential for a bullish wave and is issuing bullish signal, unlike RSI. Traders can be waiting for MACD bars to issue negative signals once more and then they can enter short positions heading to 7.825 and 7.811.
Please note that, this analysis is valid just as long as the price line has not reached 7.8515.
• DISCLAIMER: Please note that the above analysis is not an investment suggestion by “Capitalcore Ltd”. This post has been published only for educational purposes.