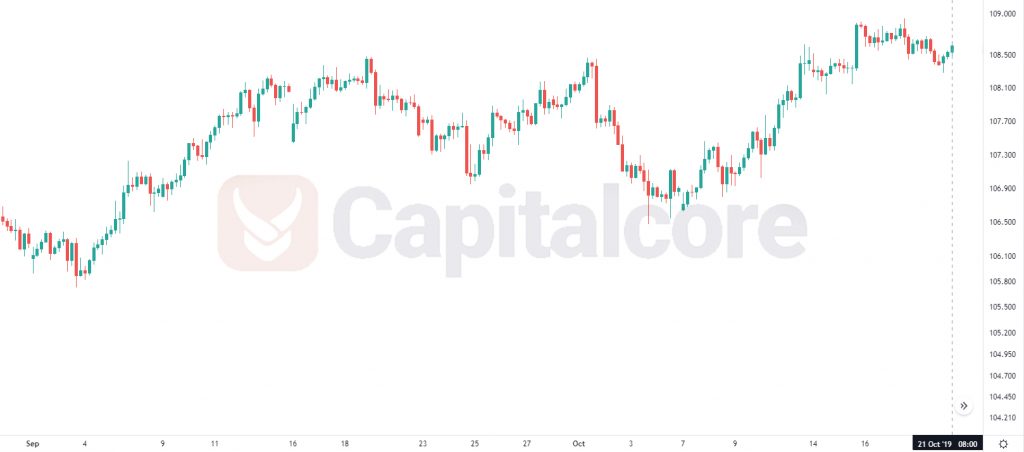
The price is at the base of the Bollinger Band
Japan released All Industries Activity Index and the US is not publishing any economic data. On the chart, the price has ascended largely and had a smooth pull back. As it looks, the next ascending phase is about to begin. Indicators are not showing clear signals but the overall look of the chart is bullish.

Chart Notes:
• Chart time-zone is UTC (+03:00)
• Candles’ time-frame is 4h.
The support rests at 108.380 with resistance at 108.680 which the weekly pivot point at 108.460 is located in between the lines. The EMA of 10 is moving horizontally in the ascendant channel and it is above the EMA of 200 and the EMA of 100. The RSI is moving below 50 level, the Stochastic is showing upward momentum and the MACD line is below the signal line in the negative territory. The ADX is not showing any clear signals.
USDJPY is growing up within the ascendant channel targeting 61.8 level of Fibonacci at 108.900.
• DISCLAIMER: Please note that the above analysis is not an investment suggestion by “Capitalcore Ltd”. This post has been published only for educational purposes.