Technical Indicators Suggest Bullish Outlook for USD/JPY
The USD/JPY currency pair, often referred to as the “Gopher,” is a popular forex trading pair that tracks the exchange rate between the US Dollar and the Japanese Yen. It is one of the most traded currency pairs globally, offering high liquidity and volatility, making it a favorite among traders. Today’s trading dynamics are likely to be influenced by economic indicators from both Japan and the US, including the Japanese Ministry of Finance’s data on capital expenditures and the Jibun Bank Manufacturing PMI.
Fundamentally, the USD/JPY pair may experience increased volatility today due to key economic data releases. The Japanese capital expenditures report, a significant indicator of economic health, suggests that if the actual figures exceed the forecast, the Yen could strengthen as increased business investment signals optimism in the economy. Additionally, the Jibun Bank Manufacturing PMI is set to provide insights into Japan’s manufacturing sector’s health, with readings above 50 indicating expansion. However, with US banks closed for Labor Day, reduced liquidity in USD trading could result in erratic price movements. Traders should be cautious of potential spikes in volatility due to the lower trading volume, which might amplify reactions to the Japanese economic releases.
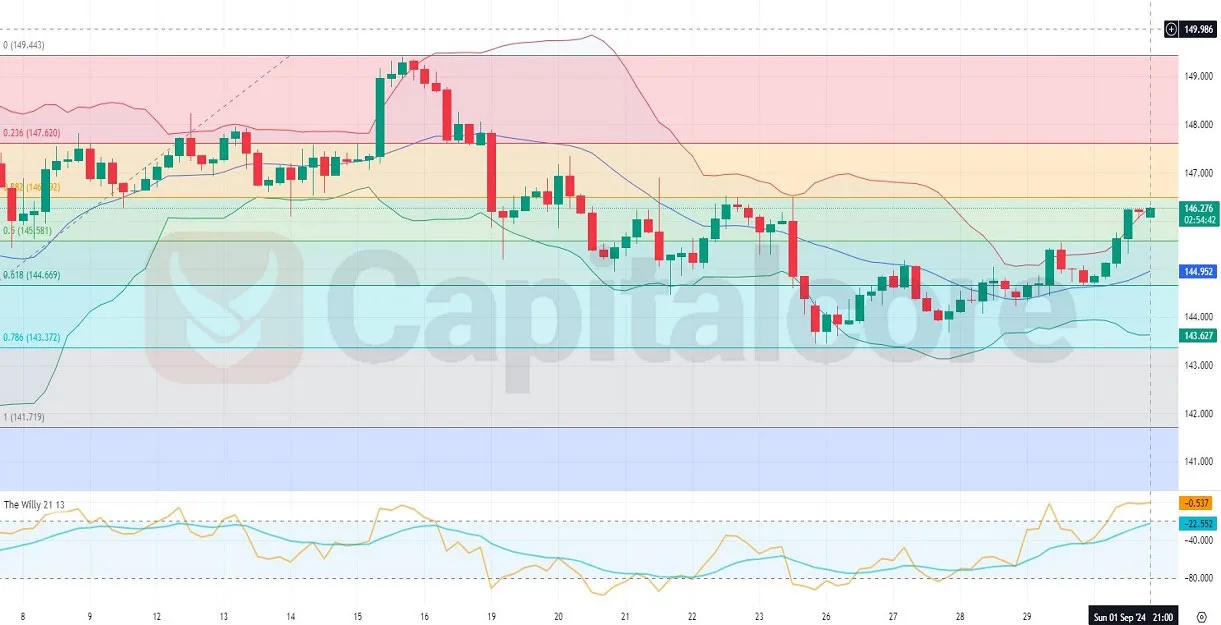
Chart Notes:
• Chart time-zone is UTC (+03:00)
• Candles’ time-frame is 4h.
From a technical perspective, the USD/JPY H4 chart indicates a light bullish trend, with recent price action dominated by bullish candlesticks. The pair is currently trading near the upper Bollinger Band, signaling strong upward momentum. The price has been oscillating between the middle and upper Bollinger Bands, suggesting a prevailing bullish sentiment. The Bollinger Bands are widening, which typically indicates increasing volatility. Furthermore, the price is situated between the 0.5 and 0.382 Fibonacci retracement levels, a zone that often serves as a resistance area. If the price breaks above this zone, it may continue its upward trajectory; otherwise, a reversal could be possible if the bearish candles gain dominance. The Willy indicator shows mixed signals but leans slightly towards overbought conditions, warranting caution for potential corrections.
• DISCLAIMER: Please note that the above analysis is not an investment suggestion by “Capitalcore LLC”. This post has been published only for educational purposes.