USDJPY Technical Outlook: Descending Channel and Bearish Indicators
The USD/JPY currency pair, also known as “The Ninja,” is a key barometer of the forex market, providing insights into the economic health and monetary policy stances of both the United States and Japan. The USD JPY pair’s movements are influenced by various economic indicators, central bank policies, and geopolitical events. As we look ahead to the upcoming economic data releases today, we can anticipate their potential impacts on the pair’s performance. Today, the focus is on several Japanese economic indicators, including Average Cash Earnings, Bank Lending, Current Account, and Economy Watchers Sentiment. The Average Cash Earnings forecast of 2.1% indicates modest wage growth, suggesting stable consumer spending potential, while Bank Lending at 3.1% reflects a positive borrowing environment, indicating confidence among businesses and consumers. The Current Account forecast of 2.07 trillion yen underscores a healthy trade surplus, potentially boosting the yen through increased foreign currency demand. Finally, the Economy Watchers Sentiment at 46.1 points to mild pessimism but remains a crucial gauge of consumer sentiment. In the U.S., the Consumer Credit data forecast at 10.7 billion USD suggests an increase in consumer borrowing, highlighting confidence in financial stability and spending capability. These mixed signals from Japan and steady consumer behavior from the U.S. will likely keep the USD-JPY in a state of cautious trading, awaiting more decisive trends.
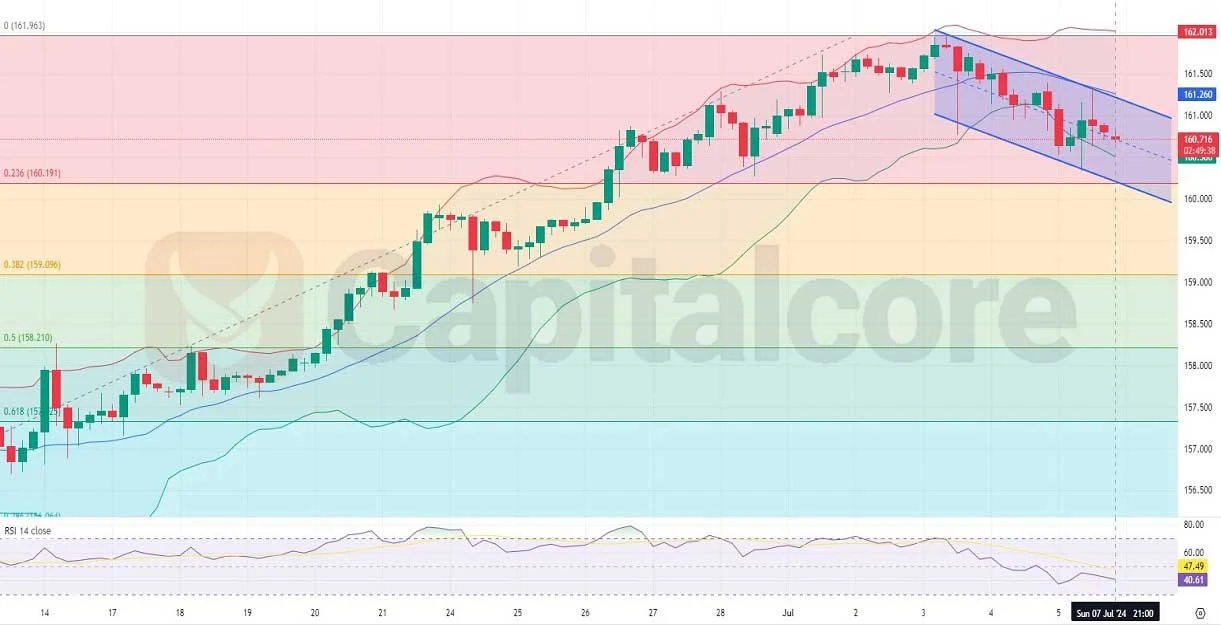
Chart Notes:
• Chart time-zone is UTC (+03:00)
• Candles’ time-frame is 4h.
Analyzing the H4 chart of USD/JPY, we observe the price action within a descending channel following a recent peak. The Bollinger Bands show the price moving within the lower half, indicating a bearish trend. This is supported by the RSI, which has dropped below the neutral 50 level and stands at 40.61, suggesting further downside momentum. Fibonacci retracement levels reveal critical support and resistance points, with the price currently hovering around the 0.236 level at 160.191, struggling to find direction. The overall market sentiment has shifted bearish after a strong bullish trend throughout June and early July, with the last 15 candles showing a majority of bearish pressure. The current price behavior, along with these technical indicators, suggests a continuation of the bearish trend unless significant fundamental changes provide new direction.
• DISCLAIMER: Please note that the above analysis is not an investment suggestion by “Capitalcore Ltd”. This post has been published only for educational purposes.