- January 29, 2019
- Category: Market News
USD is trying to recover the loss against GBP
GBP has been moving strongly against USD since the beginning of January. On the chart the price is forming an ascending channel. A couple of days ago the price touched the top of the ascending channel as well as the top Bollinger Band and then decreased, the middle of the channel has not been touched yet and indicators are issuing sell signals.
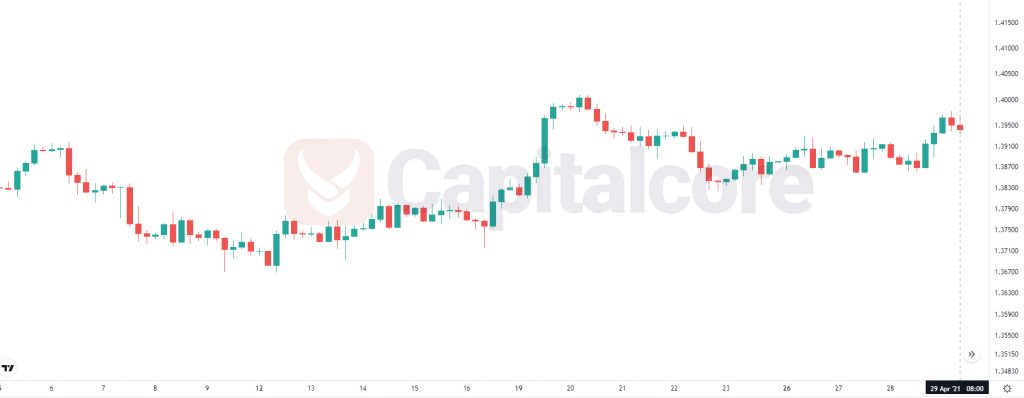
Chart Notes:
• Chart time-zone is UTC (+03:00)
• Candles’ time-frame is 4h.
The support rests at 1.31370 with resistance at 1.31710 which both lines are above the weekly pivot point at 1.30830. The EMA of 10 is moving with bullish bias in the ascendant channel and it is above the EMA 100 and the EMA of 200. The RSI is falling towards 50 level and the Stochastic is moving in low ranges. The MACD line is below the signal line in the negative territory. The ADX is showing sell signal.
While GBPUSD is growing up, there will be pullbacks on the way. Long term traders can target 1.325 but for now the support level breakthrough may push the price down towards 1.309.
• DISCLAIMER: Please note that the above analysis is not an investment suggestion by “Capitalcore Ltd”. This post has been published only for educational purposes.