Ascending after a pull back or a trend reversal?
Japan published Corporate Service Price Index and Leading Indicators. USD/JPY is on the mid-lane of an ascending channel which is also a broken resistance and is expected to pump the price up and act as a support level. the next resistance level above is at 106 which looks too fragile to hold the price.
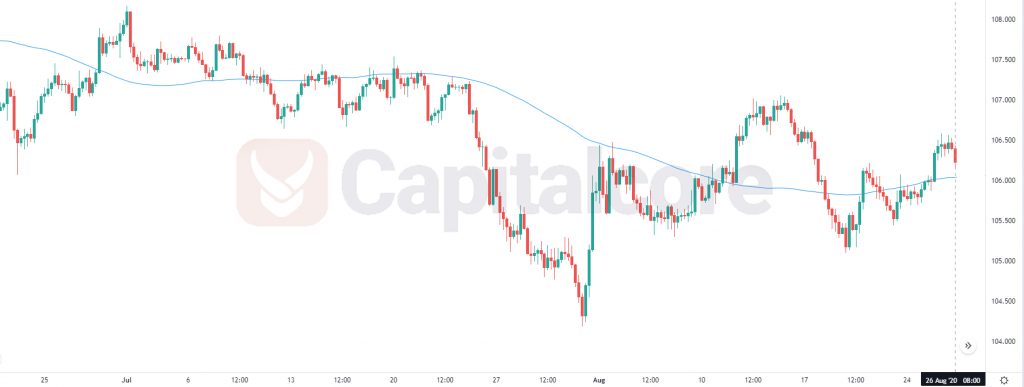
Chart Notes:
• Chart time-zone is UTC (+03:00)
• Candles’ time-frame is 4h.
The support rests at 105.990 with resistance at 106.790 which both lines are above the weekly pivot point at 105.860. The EMA of 10 is moving with bullish bias in the ascendant channel and it is below the EMA of 200 and above the EMA of 100. The RSI is falling towards level 50, the Stochastic is showing downward momentum and the MACD line is above the signal line in the positive territory. The ADX is not showing any clear signals.
While considering pullbacks, USDJPY will continue its bullish trend towards 106.850.
• DISCLAIMER: Please note that the above analysis is not an investment suggestion by “Capitalcore Ltd”. This post has been published only for educational purposes.