A descending wave is potential to occur
USD/JPY has been moving within a sideway range since 6th of June 2022; despite making several attempts the price line has not been able to break above the resistance level at 136-137. Currently the a dynamic support level has also formed below the price line.
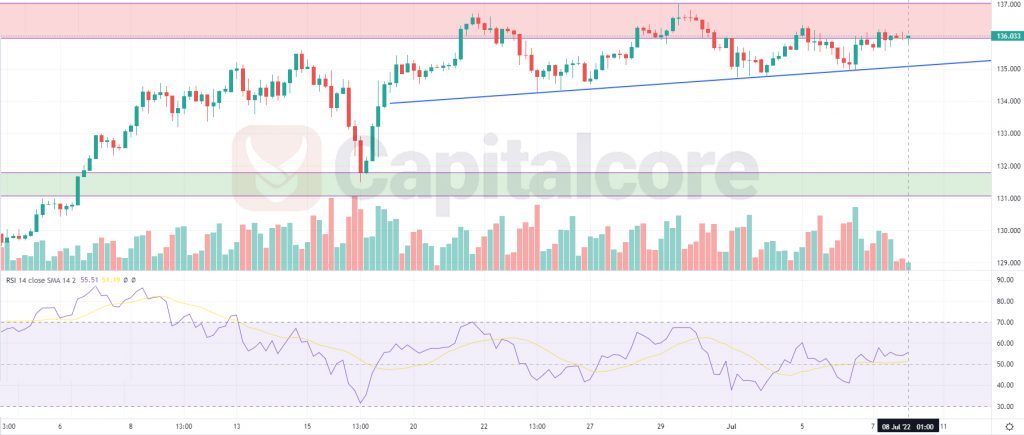
Chart Notes:
• Chart time-zone is UTC (+03:00)
• Candles’ time-frame is 4h.
The price line is indicating 136 at the moment, where would be just on the resistance at 136-137. This resistance is highlighted as a light red zone above the price line. The ascending blue line below the price line shows the dynamic support zone which has currently formed and has already been able to pump the price line several times. RSI is presently almost on 55 and the volume is decreasing. Traders can expect the price line to have a significant descent to the green zone, on the chart, which represents a support zone. For traders with less risk apatite, it is recommended to wait for price line to break below the dynamic support, and then they can enter short positions heading to 131.5.
Please note that the analysis would be of value as long as the price line has not broken above 137.5 .
• DISCLAIMER: Please note that the above analysis is not an investment suggestion by “Capitalcore Ltd”. This post has been published only for educational purposes.