Bulls should keep an eye on the chart
USD/JPY started a sharp descending rally on 15th of July 2022, which caused the price line to dump up to almost 6.4% so far. The price line is now reacting to a nested zone and some indicators are showing possibility for an up-coming bullish phase.
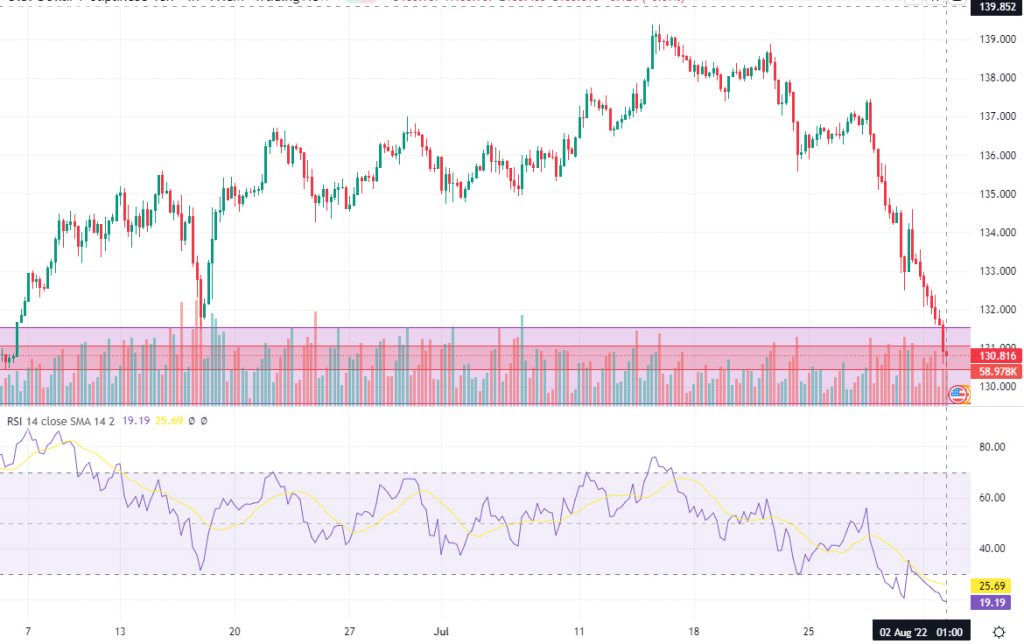
Chart Notes:
• Chart time-zone is UTC (+03:00)
• Candles’ time-frame is 4h.
The price line on USD/JPY price chart is currently showing 130.816; this area is located just inside a support zone in 4-hour-timeframe, which nests inside a stronger support zone in daily timeframe. The daily demand zone is indicated as a purple area below the price line and the nested zone is shown as a red zone, inside the purple zone. RSI also is lying on over-selling area and is also issuing a smooth ascending signal. As the demand gap is already filled, an ascending wave could be expected; traders can look for any bullish trigger to enter long positions. The target for the ascending wave could be considered on 134.25 and 136.66. Traders should also take into consideration that in case the price line breaks below 129.136, the chance would be more with bears than the bulls.
• DISCLAIMER: Please note that the above analysis is not an investment suggestion by “Capitalcore Ltd”. This post has been published only for educational purposes.