The support level is broken
Industrial Production was released in Japan and the US will publish PPI Core and PPI data. On the chart, the price line has broken below the dynamic support and has already made a pool back to it. The overall look of the chart is bullish and an ascending wave is expected.
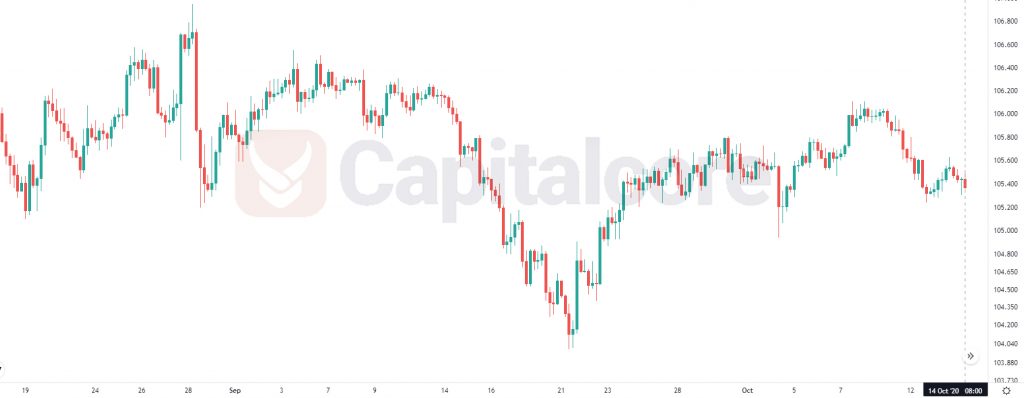
Chart Notes:
• Chart time-zone is UTC (+03:00)
• Candles’ time-frame is 4h.
The support rests at 105.300 with resistance at 105.560 which both lines are below the weekly pivot point at 105.670. The EMA of 10 is moving with bearish bias in the ascendant channel and it is below the EMA of 200 and the EMA of 100. The RSI is moving below level 50, the Stochastic is showing downward momentum and the MACD line is below the signal line in the negative territory. The ADX is showing sell signal.
USDJPY is on downward trend which is targeting 104.950
• DISCLAIMER: Please note that the above analysis is not an investment suggestion by “Capitalcore Ltd”. This post has been published only for educational purposes.