The support level looks too fragile to hold the price
Domestic Corporate Goods Price Index and Prelim Machine Tool Orders were released in Japan. The price line is on a fragile support level. different indicators are showing sell signal. Descending trendline is broken and price is expected to decline after a possible retest of the broken ascending trendline.
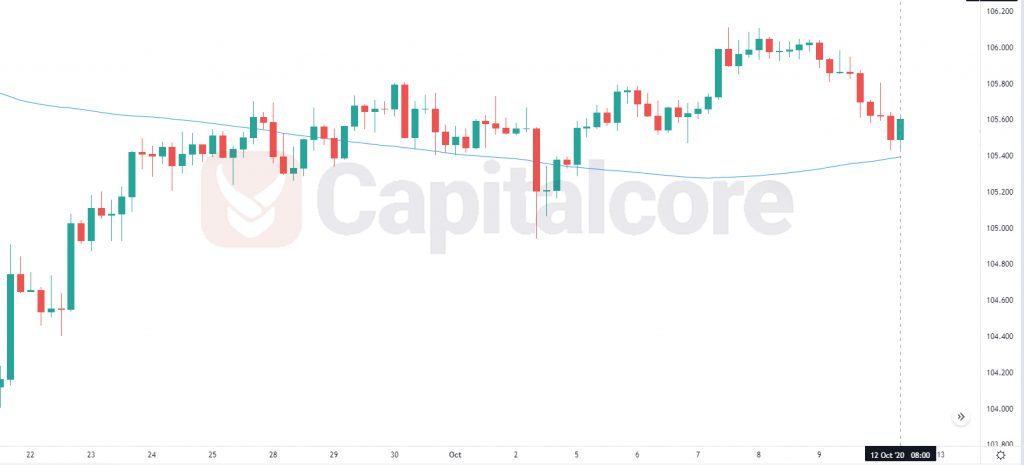
Chart Notes:
• Chart time-zone is UTC (+03:00)
• Candles’ time-frame is 4h.
The support rests at 105.210 with resistance at 105.810 which the weekly pivot point at 105.670 is located in between the lines. The EMA of 10 is moving with bearish bias in the ascendant channel and it is below the EMA of 200 and above the EMA of 100. The RSI is moving in oversold area, the Stochastic is moving in low ranges and the MACD line is below the signal line in the negative territory. The ADX is showing sell signal.
USDJPY is trying to decline towards 105.15.
• DISCLAIMER: Please note that the above analysis is not an investment suggestion by “Capitalcore Ltd”. This post has been published only for educational purposes.