- March 21, 2019
- Category: Market News
The descend has just began
There are no major economic reports in Japan but the US will release Natural Gas Storage, CB Leading Index m/m, Unemployment Claims, and Philly Fed Manufacturing Index. On the price chart, the Bulls could not overpass the strong resistance and after several tries, they gave up to Bears.
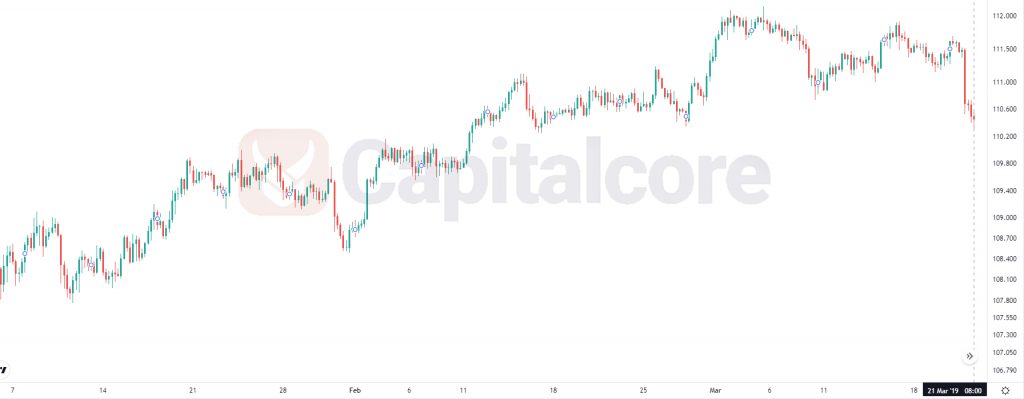
Chart Notes:
• Chart time-zone is UTC (+03:00)
• Candles’ time-frame is 4h.
The support rests at 110.160 with resistance at 110.720 which both lines are below the weekly pivot point at 111.430. The EMA of 10 is moving with bearish bias in the descendant channel and it is above the EMA of 200 and below the EMA of 100. The RSI is moving in oversold area, the Stochastic is moving in low ranges and the MACD line is below the signal line in the negative territory. The ADX is showing sell signal.
Short positions are recommended towards 110.
• DISCLAIMER: Please note that the above analysis is not an investment suggestion by “Capitalcore Ltd”. This post has been published only for educational purposes.