- December 2, 2021
- Category: Market News
The support level looks too fragile to hold the price
USD/JPY, after a sharp descend ,that started at the very first hour of 26th of November, started to bounce between a support and resistance level. At the moment the price line is getting close to the resistance level once more and the next move would be critical.
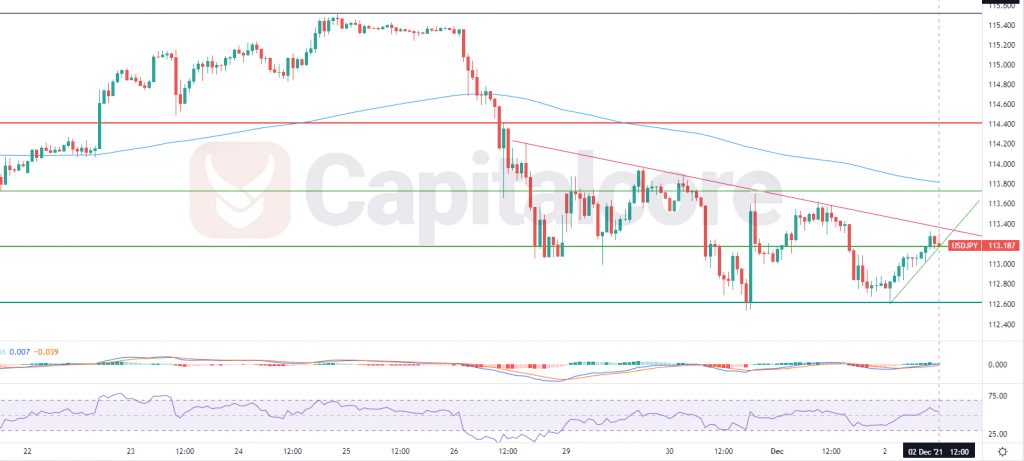
Chart Notes:
• Chart time-zone is UTC (+03:00)
• Candles’ time-frame is 1h.
The red trend line on the chart, indicates a strong dynamic resistance that started to form on 26th of November 16:00. the price is once more close to this area. RSI is above 50 but has recently experienced a change of direction. MACD is showing weakness in the ascending trend and the overall look of the chart is bearish. sellers can be waiting for the price to break below the dynamic support line, colored in green, and then can enter a short trade on the pullback. The target for the descending wave can be 112.62 which would be level 0.618 of the previous ascending wave. Bulls also can be waiting for the price to break above the red dynamic support and then can enter a long position on the pullback. the target for the ascending wave could be 113.735 and 114.4.
• DISCLAIMER: Please note that the above analysis is not an investment suggestion by “Capitalcore Ltd”. This post has been published only for educational purposes.