Will the support level hold the price?
Leading Economic Index Final has been released in Japan and the US is not releasing any economic data. On the chart, after a significant decline, the price line is now on a support level. The overall look of the chart is bearish but in case the support level can hold the price, bulls will take over the market.
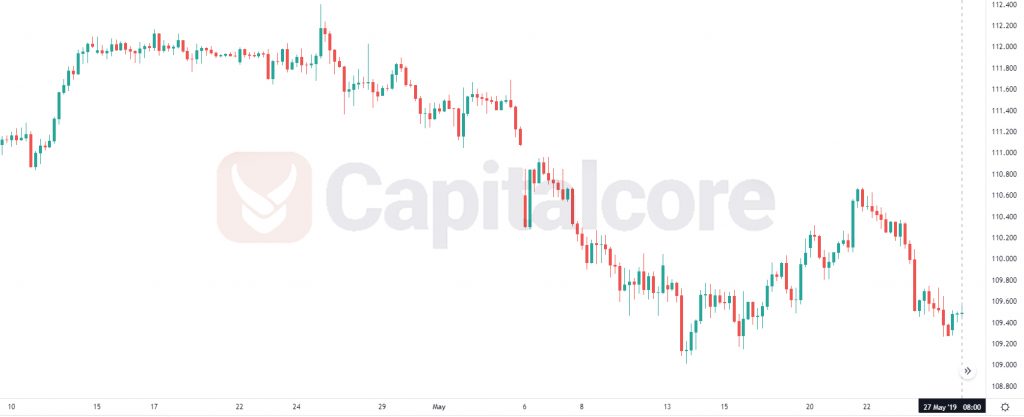
Chart Notes:
• Chart time-zone is UTC (+03:00)
• Candles’ time-frame is 4h.
The support rests at 109.230 with resistance at 109.630 which both lines are below the weekly pivot point at 109.750. The EMA of 10 is moving with bearish bias in the descendant channel and it is below the EMA of 200 and the EMA of 100. The RSI is rising towards 50 level, the Stochastic is showing upward momentum and the MACD line is below the signal line in the negative territory. The ADX is not showing any clear signals.
The resistance level breakout will push the price up towards 109.950; otherwise, USDJPY will continue its bearish trend within Andrews’ Pitchfork.
• DISCLAIMER: Please note that the above analysis is not an investment suggestion by “Capitalcore Ltd”. This post has been published only for educational purposes.