- April 7, 2022
- Category: Market News
Trend reversal might occur soon
USD/JPY started an ascending wave on 7th of March 2022. Through this ascending wave, the price line could ascend about 9% in 21 days, before reaching out to a strong resistance zone. Finally at 28th of March 2022, the price line could reach out to 125.1 and then started a smooth descending wave. The price is still reacting to the resistance zone and a trend reversal is probable of happening.
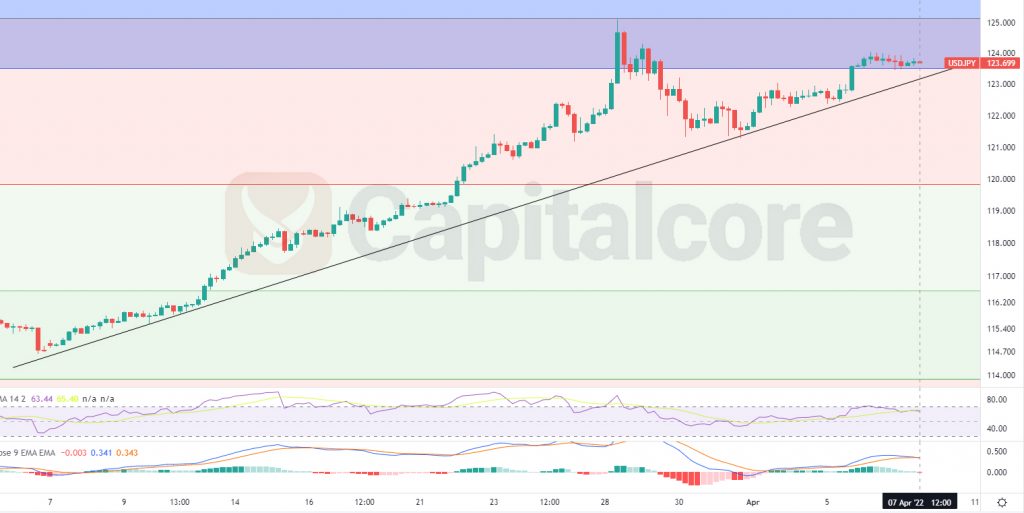
Chart Notes:
• Chart time-zone is UTC (+03:00)
• Candles’ time-frame is 4h.
On USD/JPY price chart, the price line is showing 123.699 at the moment, which would be just inside a weakly resistance zone; this zone is indicated as a blue box above the price line. This area is of high importance as the price line has reacted to that in weakly time frame. The black line on the chart indicates the ascending trend line which has formed the current bullish wave. RSI is almost on 65 and MACD is showing weakness in ascending trend. Traders can be waiting for the price line to break below the trendline and then they can enter short position on the retest of the resistance zone. The target for the discerning wave could be considered on 120 and 116.5 .
Please note that in case the price line breaks above the weakly resistance the chance would be more with bulls than bears.
• DISCLAIMER: Please note that the above analysis is not an investment suggestion by “Capitalcore Ltd”. This post has been published only for educational purposes.