Critical candlestick for USD/JPY
PMI Manufacturing, Tertiary Industry Index and PMI Composite data were released in Japan and the US will release House Price Index and Existing Home Sales. On the chart the price has formed a descending channel and at this moment, the price line is at the base of the channel. The area is of high value for the pair and losing this area will be followed by a sharp wave.
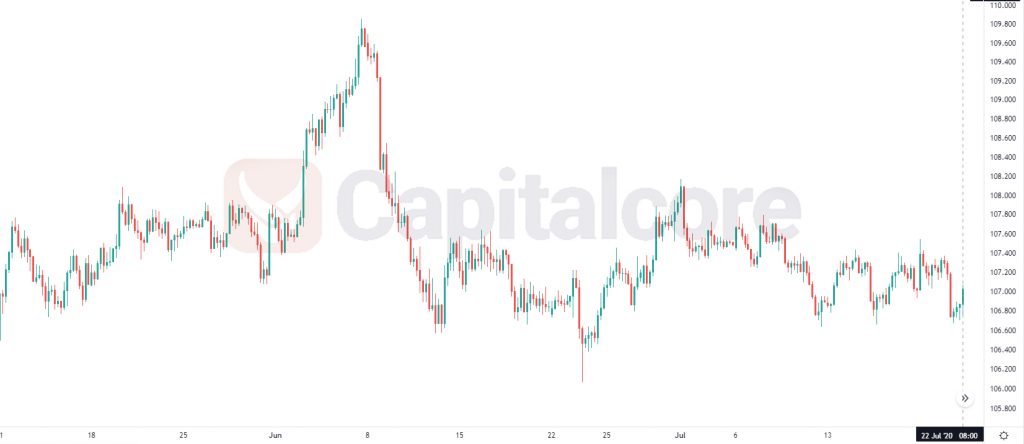
Chart Notes:
• Chart time-zone is UTC (+03:00)
• Candles’ time-frame is 4h.
The support rests at 106.640 with resistance at 106.900 which both lines are below the weekly pivot point at 107.04. The EMA of 10 is moving with bearish bias in the descendant channel and it is below the EMA of 200 and the EMA of 100. The RSI is moving below level 50, the Stochastic is moving in low ranges and the MACD line is below the signal line in the negative territory. The ADX is showing sell signal.
The correction pattern has been completed, the resistance line breakout will confirm the price growth towards 107.100; otherwise the bearish trend will continue.
• DISCLAIMER: Please note that the above analysis is not an investment suggestion by “Capitalcore Ltd”. This post has been published only for educational purposes.