- April 6, 2021
- Category: Market News
Ascending channel, still valid
Average Cash Earnings, Household Spending and 30-Year JGB Auction were released in Japan and the US will publish IBD/TIPP Economic Optimism and JOLTs Job Openings. That is why CapitalCore Ltd team, manages to have a quick review on USD/JPY price chart to find the next possible price move.
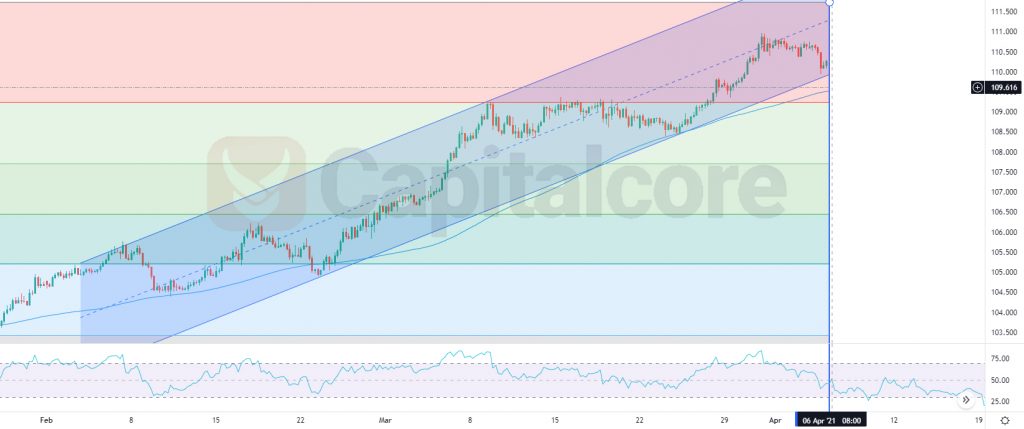
Chart Notes:
• Chart time-zone is UTC (+03:00)
• Candles’ time-frame is 4h.
The support rests at 109.950 with resistance at 110.580 which the weekly pivot point at 110.330 is located in between the lines. The EMA of 10 is moving with bullish bias in the ascendant channel and it is above the EMA of 100 and the EMA of 200. The Stochastic is moving in low ranges, the RSI is rising towards level 50. The MACD is moving in negative territory and the ADX is showing sell signal.
The pullbacks may push the price down towards 109.500 but 111 can be targeted eventually.
• DISCLAIMER: Please note that the above analysis is not an investment suggestion by “Capitalcore Ltd”. This post has been published only for educational purposes.