- October 8, 2021
- Category: Market News
RSI issuing trend trend reversal signal
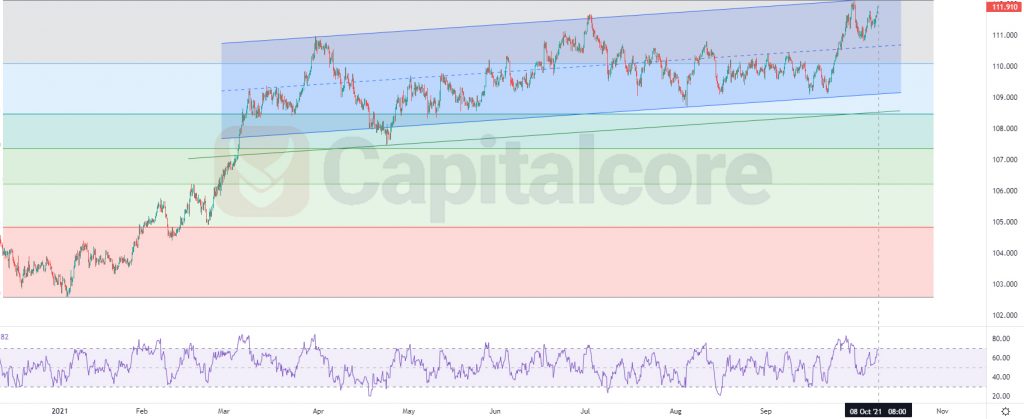
USD has been gaining power in the past several days against almost all other currencies. after a sharp ascend, USD/JPY price has been moving in a bullish channel. right now the price is on a strong resistance and several sell signals have been issued.

Chart Notes:
• Chart time-zone is UTC (+03:00)
• Candles’ time-frame is 4h.
The price line is shaping a double top on the chart. RSI indicator is showing inversion, the price line is almost at the top of an ascending channel and everything is ready for a strong bearish leg. the resistance level at 111.97 – 112.12 could push down the price several times in the past, and now again the price is touching the area. RSI indicator is showing inversion two recent tops and bears are expected to take the control of the market in the next several days. Sellers can target 111.25 as their first TP and in case the price breaks below this area, 110.84 would be the next target.
• DISCLAIMER: Please note that the above analysis is not an investment suggestion by “Capitalcore Ltd”. This post has been published only for educational purposes.