- May 31, 2022
- Category: Market News
A new record since the beginning of May, 2002
USD/JPY started a sharp ascending rally on March 7th, 2022 and on 15th of April, the price line broke above a strong resistance zone and right now the price line is having a retest of this level. Different indicators are issuing bullish signals and as it seems the price is going to ascend further on this pair.
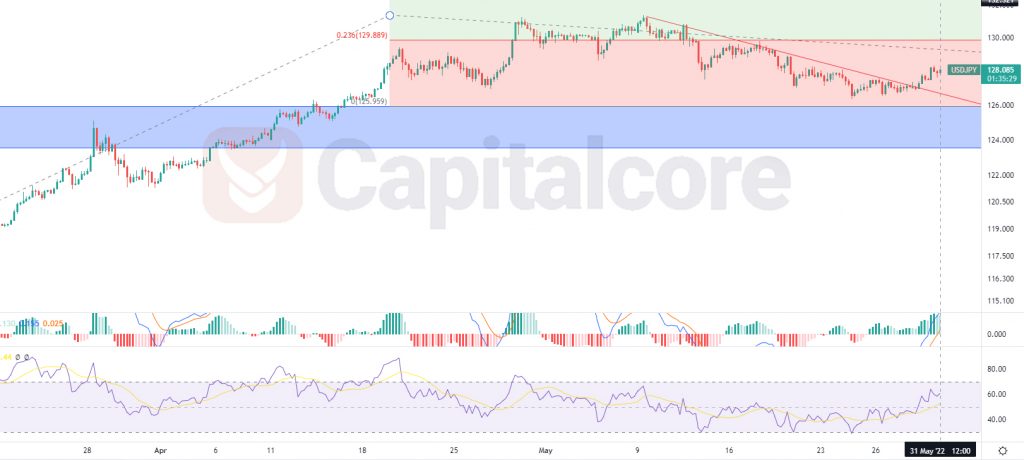
Chart Notes:
• Chart time-zone is UTC (+03:00)
• Candles’ time-frame is 4h.
The price line is showing 128.085 at the moment, which would be just above the resistance level. The blue zone on the chart indicates this resistance level which had not been broken since May 2002. The red ascending line on the chart indicates the correction trend; as you can see the price line has broken above this level. RSI is almost on 60 and the bullish trend is still valid on this indicator. MACD is showing a powerful ascending trend going on and traders can be waiting for another ascending wave. Buyers should keep an eye on the blue zone and try to hunt a long position, if the price line touches this area once more. The targets for the ascending wave could be considered on 129.8 and 132.33 .
Please consider that this theory contains value as long as the price line has not broken below the blue zone.
• DISCLAIMER: Please note that the above analysis is not an investment suggestion by “Capitalcore Ltd”. This post has been published only for educational purposes.