The price is forming descending channel.
Prelim Machine Tool Orders came in Japan and the US will publish 10-y Bond Auction and Federal Budget Balance. Meanwhile on USD/JPY price chart, the price line is forming a bearish channel, indicators are issuing bearish signals and sellers are holding the power.
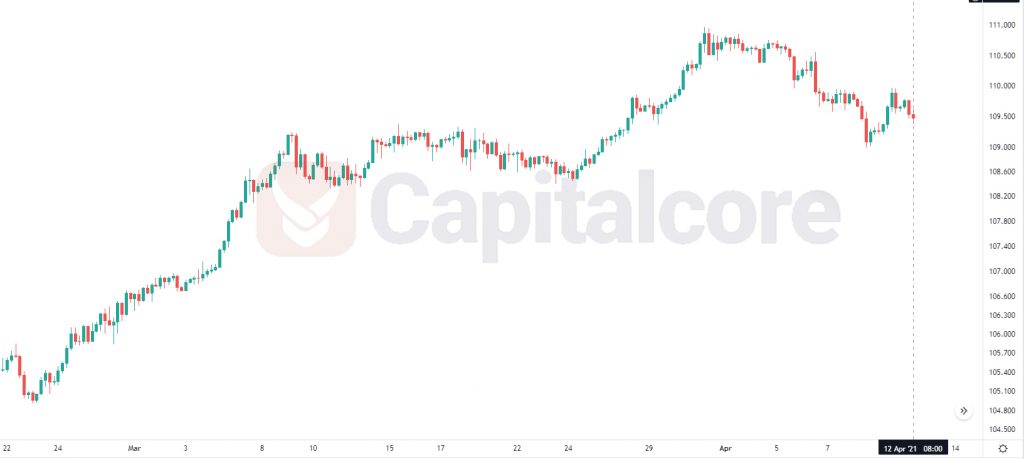
Chart Notes:
• Chart time-zone is UTC (+03:00)
• Candles’ time-frame is 4h.
The support rests at 109.110 with resistance at 110.010 which the weekly pivot point at 109.800 is located in between the lines. The EMA of 10 is moving horizontally in the descendant channel and it is above the EMA of 100 and the EMA of 200. The Stochastic is showing downward momentum, the RSI is falling towards oversold area. The MACD is moving in positive territory and the ADX is not showing any clear signals. The bearish pressure is pushing the price down towards 108.500.
• DISCLAIMER: Please note that the above analysis is not an investment suggestion by “Capitalcore Ltd”. This post has been published only for educational purposes.