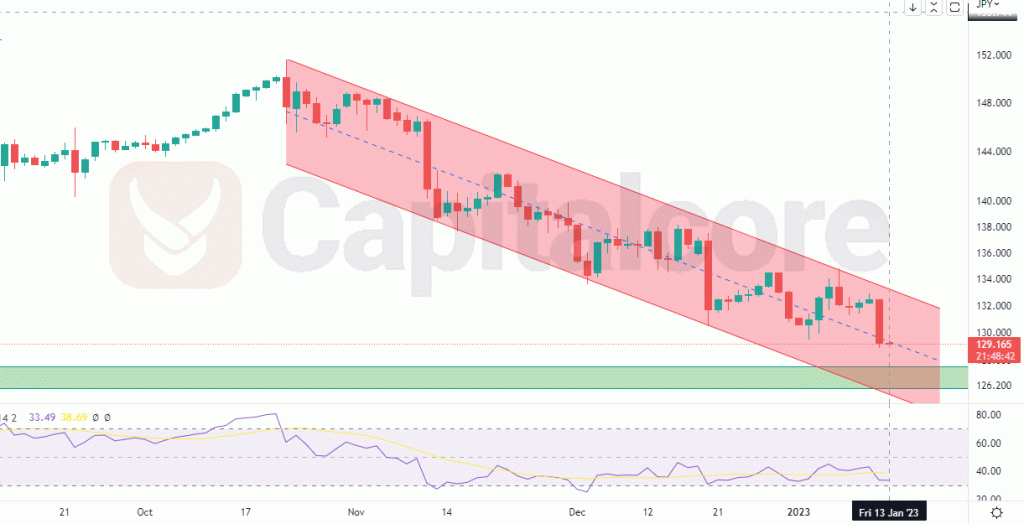
The price line is moving towards the support zone
USD/JPY price line started a descending wave on 21st of October 2022. This bearish wave caused the price line on this chart to descend up to more than 15.1% until now. At the moment, different indicators are showing potential for an upcoming bullish wave and a trend reversal could be expected.

Chart Notes:
• Chart time-zone is UTC (+03:00)
• Candles’ time-frame is daily.
The price line is currently showing 129.165 at the moment. This area is located just above a static resistance, reflected as a green box. The red zone on the chart indicates a bearish channel, within which the descending wave has occurred. The price line is currently on the mid line of this channel. As the mid line has not recorded strong reactions so far, the price line is not very probable to be pumped from this area; therefore traders could set their bullish orders on the static resistance at 126- 126.555. For live trading, it is recommended to wait until the price line reaches the green zone, and there, enter long positions when an ascending trigger is ignited. The target of the ascending wave could be considered on different Fibonacci levels on the current bearish wave.
• DISCLAIMER: Please note that the above analysis is not an investment suggestion by “Capitalcore Ltd”. This post has been published only for educational purposes.