- February 13, 2023
- Category: Market News
The price line is on a strong resistance zone
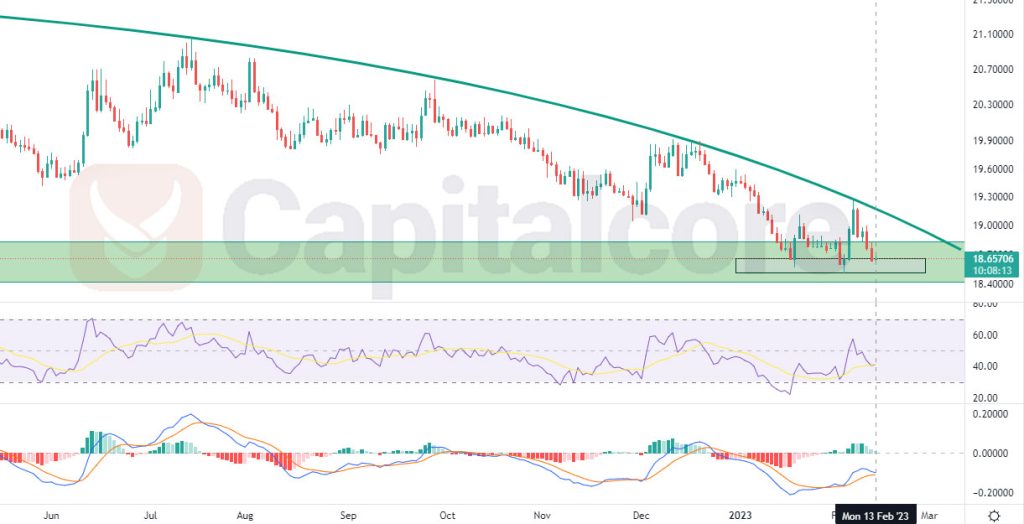
After a significant long-maintaining bearish wave, the price line on USD/MXN price chart fell on a strong demand zone, which is expected to pump the price line once more. Different indicators are issuing bullish signal and a trend reversal seems to be happening.

Chart Notes:
• Chart time-zone is UTC (+03:00)
• Candles’ time-frame is daily.
The green zone below the price line reflects the long term support zone, which is expected to have the ability to revers the current trend of USDMXN. The light zone within the green area indicates a nested zone which has recently been formed. A reversed head and shoulder pattern is being formed inside the nested zone. RSI has issued complex positive divergences and so is MACD. MACD line and Signal line are inversing and a bullish reaction could be expected. Traders could be expecting a bullish trigger being pulled; after which they can enter long positions heading to the resistance levels at 19.0800 and 19.26222 after that.
• DISCLAIMER: Please note that the above analysis is not an investment suggestion by “Capitalcore Ltd”. This post has been published only for educational purposes.