The price line is on a strong support
USD/MXN started a descending wave by the beginning 9th of March 2022 and could descend more than 5.5% until 22nd of March, when the price line reached out to a strong support zone. USD/MXN entered a side range market after that and is now possible to enter long positions.
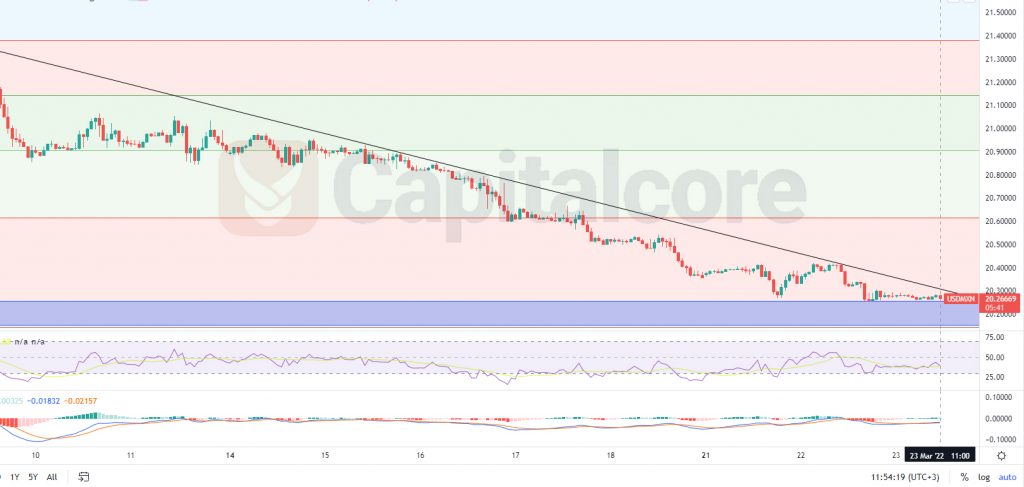
Chart Notes:
• Chart time-zone is UTC (+03:00)
• Candles’ time-frame is 4h.
The price line at the moment is showing 20.26669, which would be just above the support level which has been indicated as a blue zone on the chart. This zone is considered to be a strong one as it has been able to pump the price several times in the past. The black descending line on the chart indicates the trend line, within which the ascending wave has occurred. RSI is almost on 40 and is issuing positive divergence. MACD also showing indecision atmosphere among traders. Buyers can be waiting for the price line to break the descending trend line in black, then they can enter long positions, heading to 20.66 and 20.87.
• DISCLAIMER: Please note that the above analysis is not an investment suggestion by “Capitalcore Ltd”. This post has been published only for educational purposes.