The descending line is finally broken
USD/MXN price started a down trend on the beginning of July 2020 and despite several attempts could not break above the bearish trend line until 30th of September 2021. After breaking above the trend line, level 0.236 of the Fibonacci retracement acted as a resistance level and stopped the growth a couple of times. Today finally the price line could break above this level too.
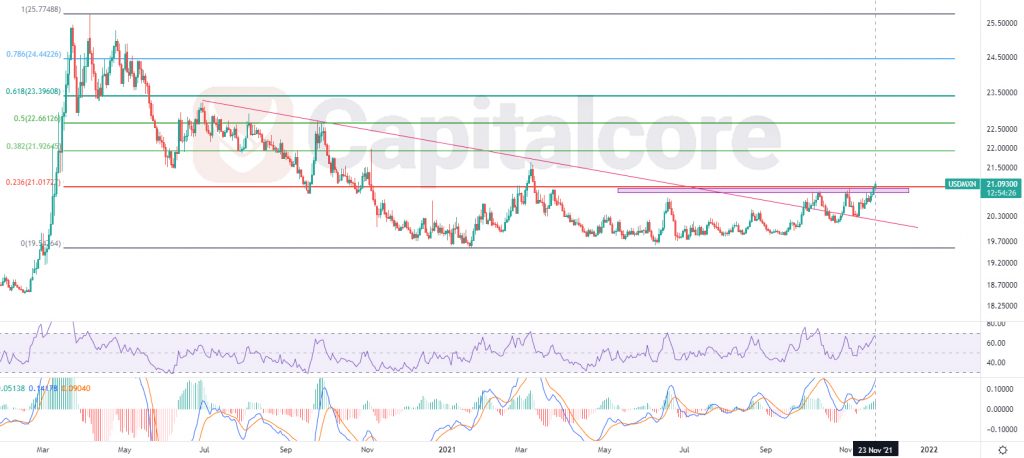
Chart Notes:
• Chart time-zone is UTC (+03:00)
• Candles’ time-frame is daily.
The price right now is on 210.93 which is just above the resistance level at 21.02. RSI indicator is showing 67 (almost) and MACD is showing a powerful up trend. The closest support level lays at 20.55. The overall look of the chat is bullish. Buyers can be waiting for a retest of the broken resistance and then can target 21.92 which would be the next level of the Fibonacci retracement (level 0.236). In case the bullish power maintains, after breaking above 21.92, the next possible target for the ascending line would be 22.67. Please note that in case the price line breaks below 20.815, the chance of the ascend will decrees.
• DISCLAIMER: Please note that the above analysis is not an investment suggestion by “Capitalcore Ltd”. This post has been published only for educational purposes.