- March 9, 2022
- Category: Market News
The price line is getting ready for a sharp move
USD/NOK started a strong bullish trend on October 28th, 2021 and the price line could rise about 11%. The price line then reached out to the resistance level on 9.08 – 9.2 on 3rd of December 2021. The price line rose to retest the resistance zone several times but it has not been able to do so yet. A dynamic support level also was formed below the price line.
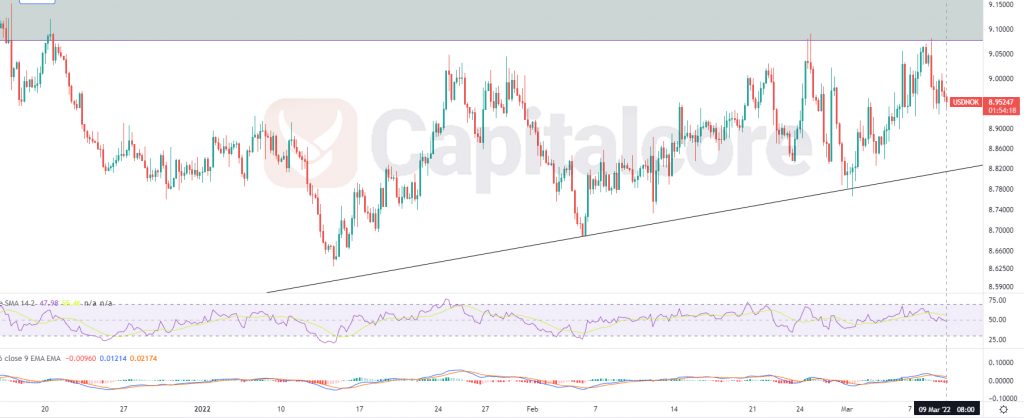
Chart Notes:
• Chart time-zone is UTC (+03:00)
• Candles’ time-frame is 4h.
On USD/NOK price chart, the line is indicating 8.95247 at the moment. The black line below the price line indicates the support level that has recently been formed and has been able to pump the price several times already. There is also a resistance level above the price line. The valleys are being formed higher than the previous one each time and this indicates that at the moment, bullish power on the chart overtakes the bearish power. RSI is on 50 and MACD is showing bearish trend on going. Traders can be waiting for any of the support or resistance zones and then they can enter the market on the same direction. Targets for the sellers can be set on 8.6 and 8.3 after that. On the other hand, if a bullish wave occurs, the wave can reach out to 9.6 and 10.12 .
• DISCLAIMER: Please note that the above analysis is not an investment suggestion by “Capitalcore Ltd”. This post has been published only for educational purposes.