The descending trend line is finally broken
USD/NOK price started a descending wave on 20th of march 2020 and the price dumped from 12.1 to 8.3 on 20th of October 2021. Since then the price line started an ascending leg and could break above the dynamic descending trend line. right now the price is on a critical spot and the next move would be of high importance.
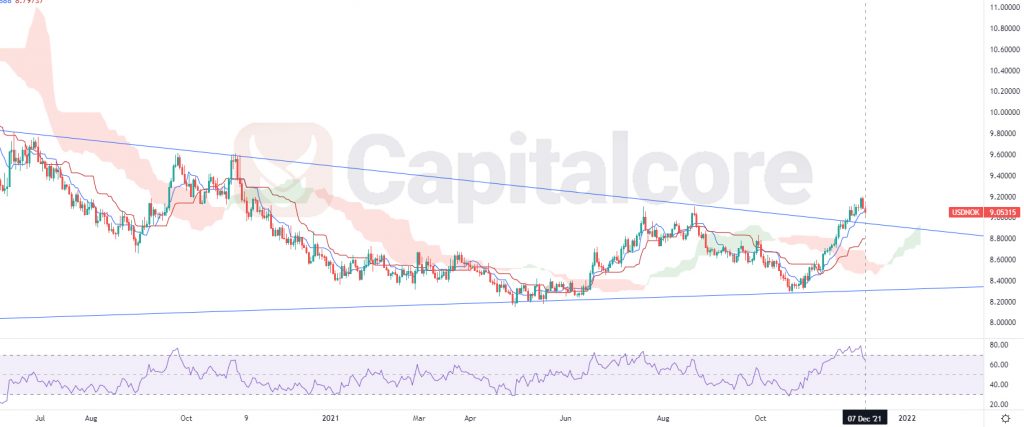
Chart Notes:
• Chart time-zone is UTC (+03:00)
• Candles’ time-frame is daily.
The price on USD/NOK chart is on 90.53 at the moment. Right below the price, lays the dynamic resistance colored in blue, which as been broken. Icimoku cloud has also been broken and the price is about to have a retest of the area. RSI is almost on 65 and the conversion line has broken above the base line on Icimoku. The overall look of the chart is bullish; in case the broken resistance converts to a support level and can stop the descending wave, buyers can enter the market. The first target for the ascending wave would be 9.55 and the next one would be 10.04. On the other hand, if the price breaks below the resistance once more, sellers can target 8.77 as their first target and 8.4 as the next one.
• DISCLAIMER: Please note that the above analysis is not an investment suggestion by “Capitalcore Ltd”. This post has been published only for educational purposes.