The price line is on a strong resistance
USD/NOK started a ranged trend on 20th of December 2021; the price line started bouncing between 9.1 and 8.6. A support and a resistance level was formed on 9.1 and 8.6. Currently the price line touched the resistance level and fall into the support level. It is probable for the price line to experience a trend reversal shortly.
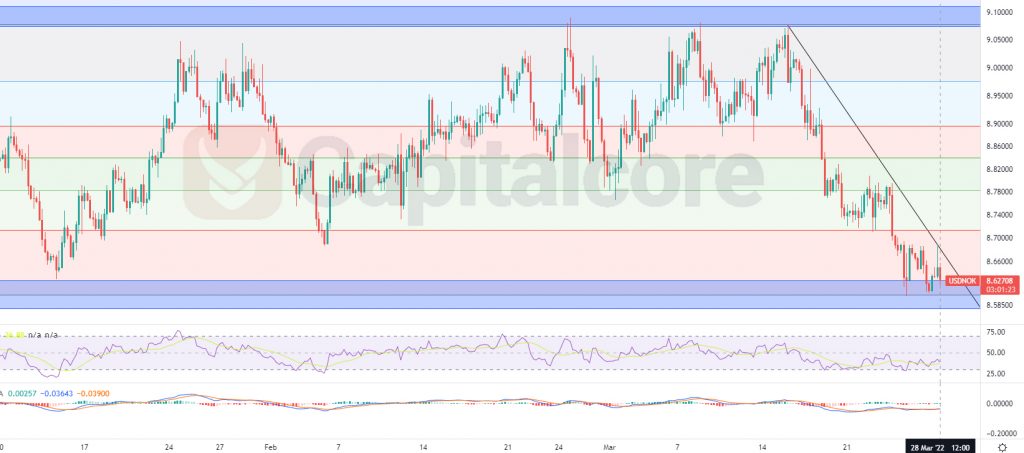
Chart Notes:
• Chart time-zone is UTC (+03:00)
• Candles’ time-frame is 4h.
The price line is on 8.62708 at the moment, which would be just on the support level which lays on 8.58 – 8.6275. The resistance and support zone are shown as blue zones on the chart. The black line indicates the trend line which was formed by the descending wave. RSI is almost on 40, is issuing negative divergence signals and MACD is showing indecision among traders. As you can see on the chart, the price line is currently unable to form lower valleys; this indicates the reduction of the descending power. Buyers can be waiting for the price line to break above the trend line and then they can be waiting for a retest of the blue support level, to enter the market. The targets for the ascending wave could be considered on 8.78, which would be level 0.382 of the Fibonacci retracement, and also 8.9 and 90.4. Please consider that this theory is of value, as long as the price line has not broken below 8.54558.
• DISCLAIMER: Please note that the above analysis is not an investment suggestion by “Capitalcore Ltd”. This post has been published only for educational purposes.