The price line is on a resistance level
The price line on USD/NZD started a bullish trend in early August 2022. the price on this pair has had a significant growth since then and is now approaching a very strong resistance level and therefore a bearish leg can be expected.
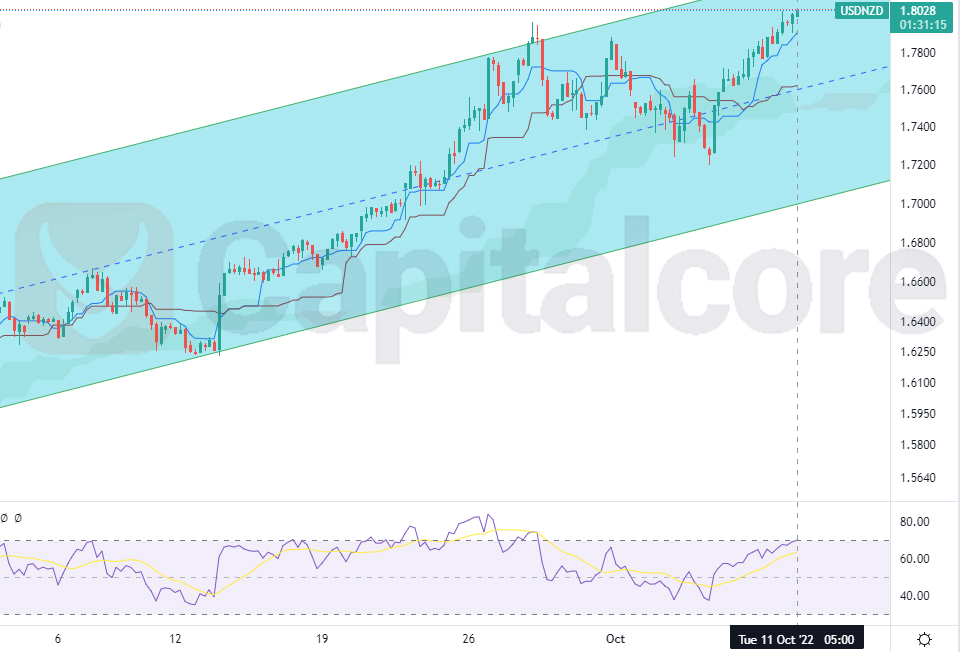
Chart Notes:
• Chart time-zone is UTC (+03:00)
• Candles’ time-frame is 4h.
The light blue area on the chart indicates the ascending channel and the price line is currently on 1.8028. Ichimiku cloud is placed below the price line with a considerable distance. RSI is almost inside over bought area and a bearish divergence signal has also been issued. The ascending slop of the chart is decreasing and bulls power seems to be weakening over the price line on this chart. Sellers can be expecting an upcoming bearish wave. The entrance could be indicated by witnessing any bearish signals on shorter time frame. The target for the bearish wave could be considered on 1.7671, and 1.7203 after that.
• DISCLAIMER: Please note that the above analysis is not an investment suggestion by “Capitalcore Ltd”. This post has been published only for educational purposes.