- January 31, 2022
- Category: Market News
Price line has reached a strong resistance
USD/NZD price has recently gone through an ascending wave, after the strong descend that it had experienced on 23rd of March 2020 to 25th of February 2021. The price line is now reaching to level 0.382. Different indicators have issued bearish signals and the price is ready for the next descending phase.
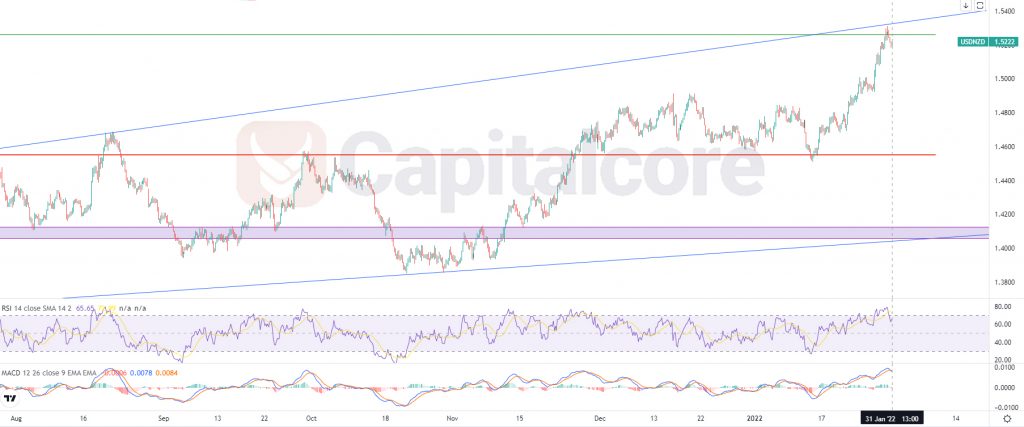
Chart Notes:
• Chart time-zone is UTC (+03:00)
• Candles’ time-frame is 4h.
The price line on USD/NZD price chart, at the moment, is on 1.5222, which would be just below level 0.382 of the Fibonacci retracement. The area is of high importance and has changed the market trend, so it is not expected to be easily broken. MACD is showing the commencement of a descending phase. The blue line above the price line shows the dynamic resistance which has been able to stop the ascend several times in the past. RSI is almost on 65 and has issued a positive divergence. Sellers can be waiting for the price line to reach out to the green line once more and then they can enter the market and open short positions. The target for the descending wave could be considered on 1.46 and 1.41. Please consider that in case the price line breaks above the blue line, the chance for descending wave to occur would highly reduce.
• DISCLAIMER: Please note that the above analysis is not an investment suggestion by “Capitalcore Ltd”. This post has been published only for educational purposes.