The price line is on an important support level
On NZD/USD price chart, the price line is currently on 1.5897; which would be just above level 0.5 of the Fibonacci retracement on the previous major descending wave on weekly time frame. The descending slope started to decrease on this pair as the price line approached the support zone on 1.58; and after reacting to this area, the overall look on the chart is now bullish.
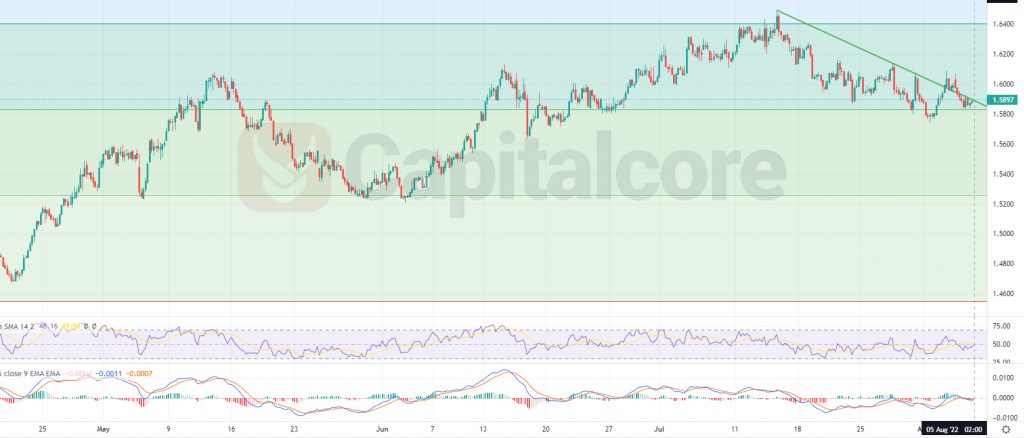
Chart Notes:
• Chart time-zone is UTC (+03:00)
• Candles’ time-frame is 4h.
The green descending line on the chart indicates the trend line which has formed the current descending wave on the chart. The light green level, to which the price line is making multiple reactions, represents level 0.5 of the Fibonacci retracement. As it is reflected on the chart, the bearish slope of the chart is decreasing and the final candles on the weekly time frame are indicating the possibility for the bearish wave to be ending. MACD is showing weakness on the bearish trend and RSI has started a bullish wave. Traders can be waiting for the price line to have another retest of the Fibonacci retracement and there they can enter long positions heading to 1.6398 and 1.6596 after that. Traders with less risk apatite can be waiting for the price line to break above the bearish trend line, ad then they can enter bullish positions on the retest of the trend line. Buyers should also take into the consideration that the chance for an ascending line would highly decrease if the price line forms a lower low on the current descending wave.
• DISCLAIMER: Please note that the above analysis is not an investment suggestion by “Capitalcore Ltd”. This post has been published only for educational purposes.