The support level looks too fragile to hold the price
USD/NZD started an uptrend on 29th of October and could ascend up to 6.3% in 33 days. The price then reacted to the resistance level at 1.47 – 1.477 and started to descend smoothly. the price right now is below the resistance level and a descending phase seems close.
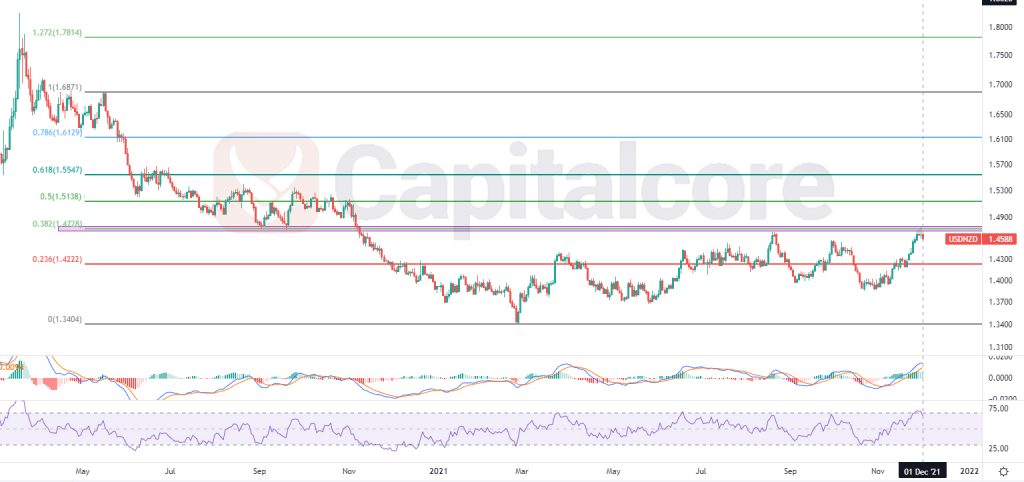
Chart Notes:
• Chart time-zone is UTC (+03:00)
• Candles’ time-frame is daily.
The price is on 1.4588 at the moment and below the resistance level at 1.47 which equals to level 0.382 of the Fibonacci retracement. RSI is above 70 and MACD shows weakness in ascending phase. Bears can be waiting for the price line to have a retest of the resistance level to enter a short position. The target for the descending wave could be 1.4222, in case the wave is strong enough to break this level, the next target can be 1.39 and 1.34 after that. Please consider that breaking above 1.491 highly reduces the chance of descent.
• DISCLAIMER: Please note that the above analysis is not an investment suggestion by “Capitalcore Ltd”. This post has been published only for educational purposes.