A bullish phase might occur shortly
USD/NZD started a bullish phase on 9th of March 2020, the bullish phase continued until 25th of February 2021, when a new climax was formed on NZD/USD; since then, a descending channel was formed and the price line started descending. Right now the price line is on the midline of the channel and an ascending wave to the top line is possible.
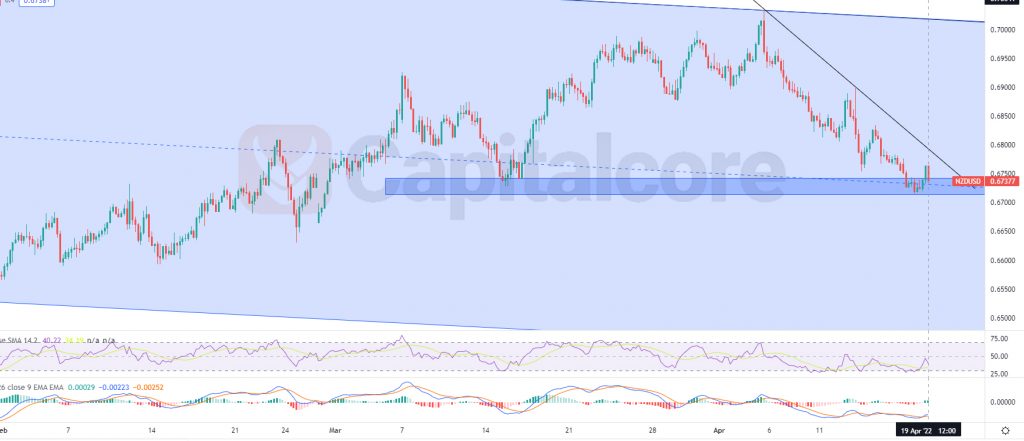
Chart Notes:
• Chart time-zone is UTC (+03:00)
• Candles’ time-frame is 4h.
The price line at the moment is indicating 0.67377, which would be just on the mid line of the channel. A static support zone also lays below the price line at 0.67 – 0.675; this zone is indicated as a blue box. The clack line on the chart indicates the trend line which has firmed the current descending wave. MACD is showing potential for a bullish wave to occur and RSI is almost on 40 and is also issuing bullish divergence signal. Traders can be waiting for the price line to break above the black trend line. then they can enter ling position on the pull back of the static resistance. The target for the upcoming ascending wave could be considered on 0.6865 and 0.7.
Please note that, in case the price line breaks below the static support, the chance for an ascending wave would highly decrease.
• DISCLAIMER: Please note that the above analysis is not an investment suggestion by “Capitalcore Ltd”. This post has been published only for educational purposes.