The price line is approaching a resistance level
The price line on USD/PLN price chart is approaching to a resistance level, after a major ascending motion. The mentioned resistance level has already been able to dump the price line a couple of times and therefore is not expected to get broken easily; also the area lays around number 5.000000 and therefore a bug amount of supply is considered to be present there.
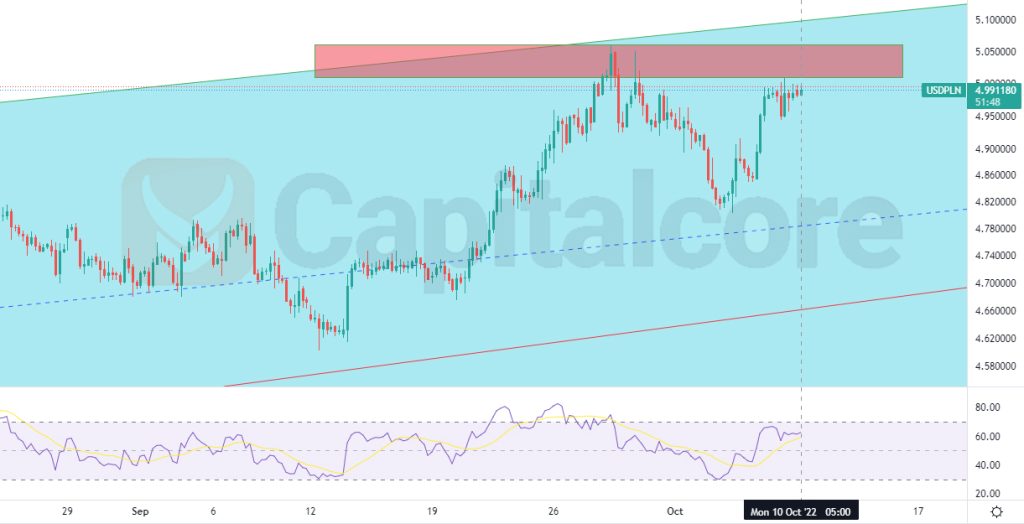
Chart Notes:
• Chart time-zone is UTC (+03:00)
• Candles’ time-frame is 4h.
The price line on USD/PLN price chart is showing 4.991180, that would be located just below the resistance level, indicated with light red color. The blue area is reflecting a long term ascending channel to which the price line has already recorded multiple reactions, to its top, bottom and mid line. The red ascending line indicates the shorter trend line which has formed the current ascending leg within the channel. Different indicators, including RSI and MACD are issuing negative signals and traders can expect a bearish leg; the entering porin can be detected, on witnessing any bearish signals in shorter time frames. The target can be set on the support level on 4.827055, and the support levels below that on 4.5572154 and 4.517161.
• DISCLAIMER: Please note that the above analysis is not an investment suggestion by “Capitalcore Ltd”. This post has been published only for educational purposes.