The support level looks too fragile to hold the price
On USD/PLN price chart, the price line started a sharp ascending rally on 10th of February 2022 and could ascend up to more than 18% until 7th of March. The price line then descended to the mid line of the channel and after a correction phase, another descending lane is taking place.
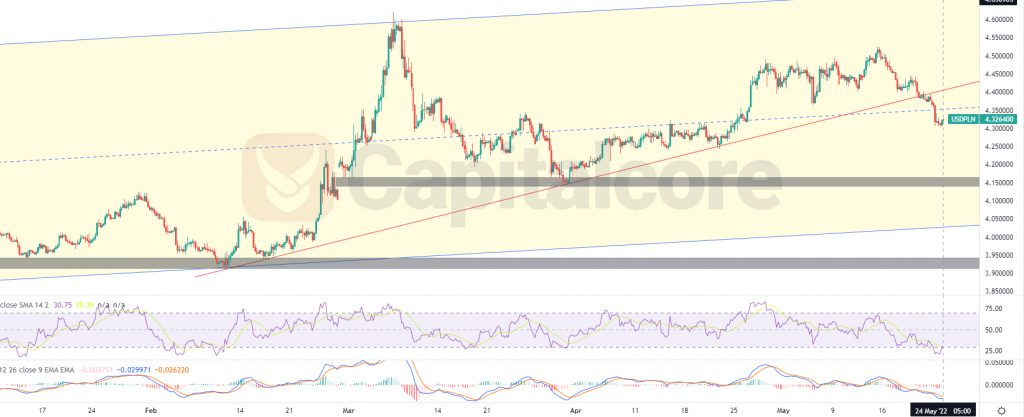
Chart Notes:
• Chart time-zone is UTC (+03:00)
• Candles’ time-frame is 4h.
On USD/PLN price chart, the price line is showing 4.3264 at the moment. The red ascending line indicates the trend line which has formed the previous ascending trend. The yellow zone shows the ascending channel, within which the price line is moving. The gray zones below the price line indicate the demand areas which are potential of pumping the price. As you can see on the chart, the price line has majorly broken below the trend line and is having a pullback to the midline of the channel. RSI is on overselling area and MACD is showing negative trend going on. Traders can be waiting for the price line to have a retest of the midline, or the trend line, then they can enter short positions and set target on the support zones which are indicated as gray zones, laying at about 4.15 and 3.95.
Please consider that the analysis would expire if the price line breaks above the trend line once more.
• DISCLAIMER: Please note that the above analysis is not an investment suggestion by “Capitalcore Ltd”. This post has been published only for educational purposes.